Unlock a world of possibilities! Login now and discover the exclusive benefits awaiting you.
- Qlik Community
- :
- All Forums
- :
- QlikView App Dev
- :
- Re: change scale graph
- Subscribe to RSS Feed
- Mark Topic as New
- Mark Topic as Read
- Float this Topic for Current User
- Bookmark
- Subscribe
- Mute
- Printer Friendly Page
- Mark as New
- Bookmark
- Subscribe
- Mute
- Subscribe to RSS Feed
- Permalink
- Report Inappropriate Content
change scale graph
Helo there,
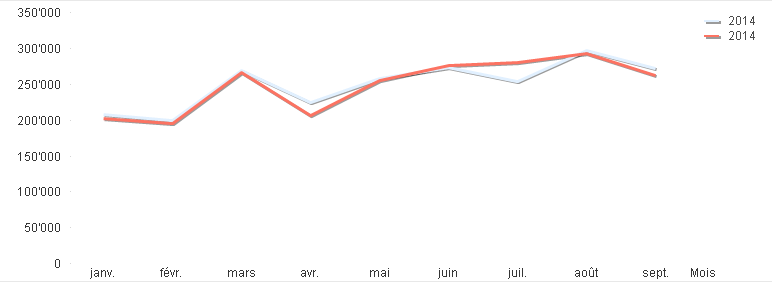
I am working on this graph and i need to change the scale....i cannot figure out how to do it ...any clue...
i would like to set the minimum value to 150'000 instead of 0 to make it better looking ![]()
thanks
JP

Accepted Solutions
- Mark as New
- Bookmark
- Subscribe
- Mute
- Subscribe to RSS Feed
- Permalink
- Report Inappropriate Content
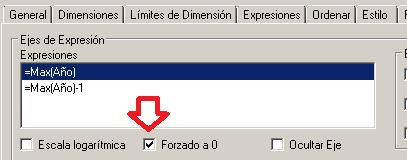
Hi, In the Axis tab, uncheck the option 'Forced to zero', it can be checked for each expression

- Mark as New
- Bookmark
- Subscribe
- Mute
- Subscribe to RSS Feed
- Permalink
- Report Inappropriate Content
On the Properties | Axes tab, you can check the box next to Static Min and enter a value in the box next to Static Min.

- Mark as New
- Bookmark
- Subscribe
- Mute
- Subscribe to RSS Feed
- Permalink
- Report Inappropriate Content
Hi, In the Axis tab, uncheck the option 'Forced to zero', it can be checked for each expression

- Mark as New
- Bookmark
- Subscribe
- Mute
- Subscribe to RSS Feed
- Permalink
- Report Inappropriate Content
in axis tab you can set min and max (dynamic too) and uncheck forced 0
in number tab you can use symbol for million (M) and thousand (k)

- Mark as New
- Bookmark
- Subscribe
- Mute
- Subscribe to RSS Feed
- Permalink
- Report Inappropriate Content
thanks to all ![]() it is great to have this community
it is great to have this community
- Mark as New
- Bookmark
- Subscribe
- Mute
- Subscribe to RSS Feed
- Permalink
- Report Inappropriate Content
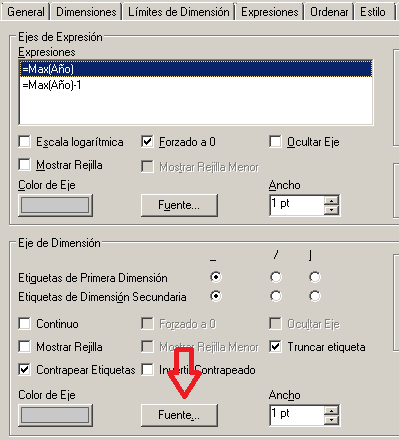
in axis tab there are 2 buttons for the 2 axis font
- Mark as New
- Bookmark
- Subscribe
- Mute
- Subscribe to RSS Feed
- Permalink
- Report Inappropriate Content
one last question...what about the dimension..i can not manage to change the size of the month Jan fev march.etc..
- Mark as New
- Bookmark
- Subscribe
- Mute
- Subscribe to RSS Feed
- Permalink
- Report Inappropriate Content
Hi Jean-Philippe, to change dimension font use the second Font button:

- Mark as New
- Bookmark
- Subscribe
- Mute
- Subscribe to RSS Feed
- Permalink
- Report Inappropriate Content
mmmmmmerci ![]() so simple need to go home..
so simple need to go home..