Unlock a world of possibilities! Login now and discover the exclusive benefits awaiting you.
- Qlik Community
- :
- All Forums
- :
- QlikView App Dev
- :
- Re: change the color for pivot table.
- Subscribe to RSS Feed
- Mark Topic as New
- Mark Topic as Read
- Float this Topic for Current User
- Bookmark
- Subscribe
- Mute
- Printer Friendly Page
- Mark as New
- Bookmark
- Subscribe
- Mute
- Subscribe to RSS Feed
- Permalink
- Report Inappropriate Content
change the color for pivot table.
HI guys,
Please find the below image it contains some values . in this chart i want change the color for the values .
if the values are 0-2 red ,2 - 5 blue, 5 -10 green.
How i can change the color for those values in pivot table
Thanks in advance
- Mark as New
- Bookmark
- Subscribe
- Mute
- Subscribe to RSS Feed
- Permalink
- Report Inappropriate Content
What expression do you used to get the follow values? In that clue only we can figure out to troubleshoot of BG color
- Mark as New
- Bookmark
- Subscribe
- Mute
- Subscribe to RSS Feed
- Permalink
- Report Inappropriate Content
Hi,
Wring that if condition in The image shown below,area of expression like:

=if(value='so-so',Red(),if(value='so-so',Blue())--------->> Try by putting your values thr
- Mark as New
- Bookmark
- Subscribe
- Mute
- Subscribe to RSS Feed
- Permalink
- Report Inappropriate Content
You have 1,3,5 in the single cell. How do you consume for BG Color? What was the logic behind on that?
- Mark as New
- Bookmark
- Subscribe
- Mute
- Subscribe to RSS Feed
- Permalink
- Report Inappropriate Content
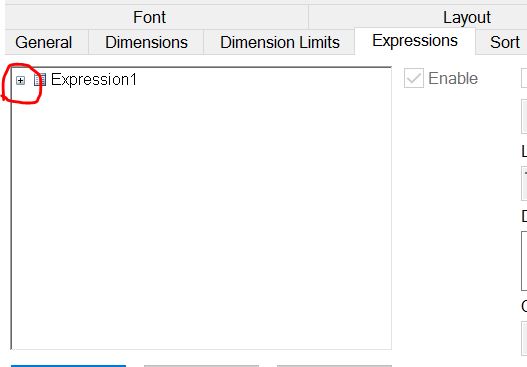
In the chart properties, Go to,
Properties --> Expressions --> Expand expression as shown below.
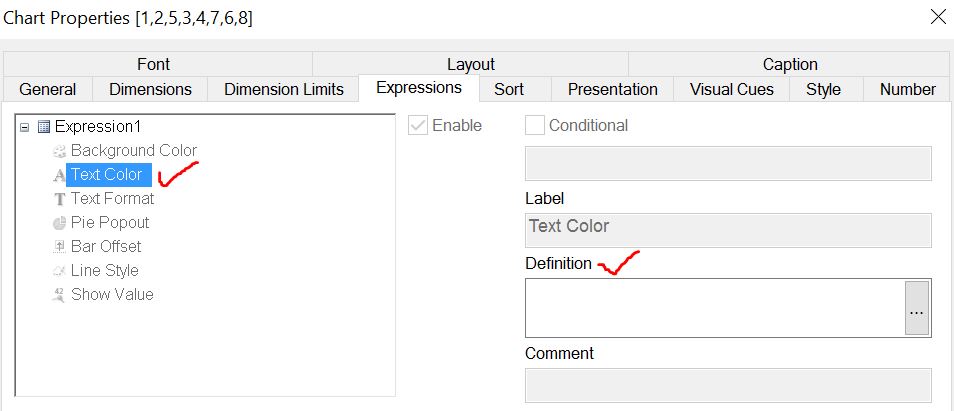
Select Text Color and Write the below expression in the Definition.
If((Your Expression)>=0 and (Your Expression)<=2,Red(), If((Your Expression)>=3 and (Your Expression)<=5,Lightblue(), If((Your Expression)>=6 and (Your Expression)<=10,Green()))). see the below image
- Mark as New
- Bookmark
- Subscribe
- Mute
- Subscribe to RSS Feed
- Permalink
- Report Inappropriate Content
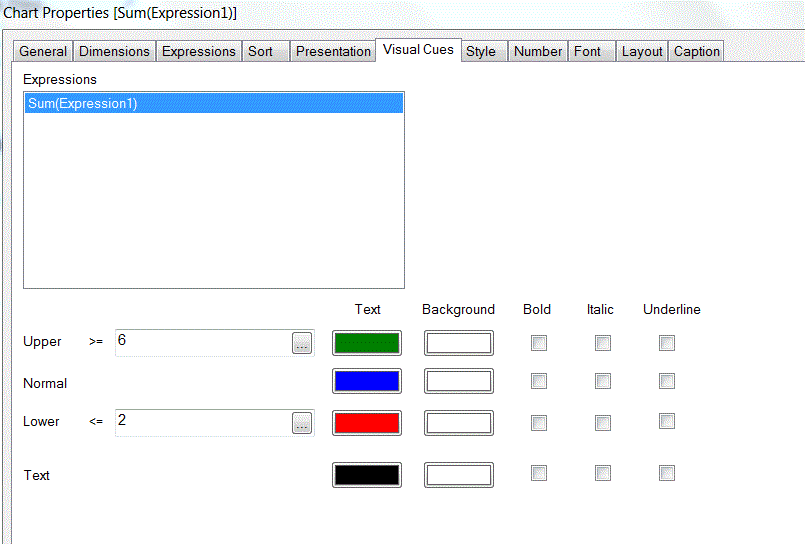
Hi,
why not use the Visuals Cues like this, you also have to change Your rates, you can not have for ex 2 in both red and blue. 0-2 red, 3-5 blue, 6-10 green for ex.
- Mark as New
- Bookmark
- Subscribe
- Mute
- Subscribe to RSS Feed
- Permalink
- Report Inappropriate Content
Hi Johansson,
Would it not be a problem if you have multiple ranges of value?
- Mark as New
- Bookmark
- Subscribe
- Mute
- Subscribe to RSS Feed
- Permalink
- Report Inappropriate Content
It will Works for 3 ranges, but thats the limit.