Unlock a world of possibilities! Login now and discover the exclusive benefits awaiting you.
- Qlik Community
- :
- All Forums
- :
- QlikView App Dev
- :
- Re: chart issue + expression label issue
- Subscribe to RSS Feed
- Mark Topic as New
- Mark Topic as Read
- Float this Topic for Current User
- Bookmark
- Subscribe
- Mute
- Printer Friendly Page
- Mark as New
- Bookmark
- Subscribe
- Mute
- Subscribe to RSS Feed
- Permalink
- Report Inappropriate Content
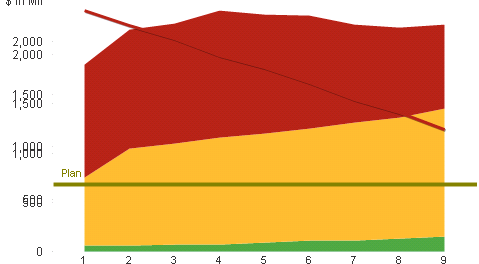
chart issue + expression label issue
Dimension label are perfect but expression labels are not properly seating.
Both chart has same dimension and static max expression.
Accepted Solutions
- Mark as New
- Bookmark
- Subscribe
- Mute
- Subscribe to RSS Feed
- Permalink
- Report Inappropriate Content
Problem was with my expression used in Static Max to size the Y-axis.
I got confused since there are 5 expressions, fixed it using rangemax() function. It looks perfect now.
Thanks for the response and helpful ideas.
- Mark as New
- Bookmark
- Subscribe
- Mute
- Subscribe to RSS Feed
- Permalink
- Report Inappropriate Content
maybe you should try to set the expression values on different axis. (make a second expression axis) you can do this in the menu 'axes'
- Mark as New
- Bookmark
- Subscribe
- Mute
- Subscribe to RSS Feed
- Permalink
- Report Inappropriate Content
The chart areas are scaled differently I guess. Press Ctrl-Shift and align the red boxes of the two overlapping charts until the Y-labels have a perfect fit.
Peter
- Mark as New
- Bookmark
- Subscribe
- Mute
- Subscribe to RSS Feed
- Permalink
- Report Inappropriate Content
You can also choose to make the color of the y-axis transparent.
- Mark as New
- Bookmark
- Subscribe
- Mute
- Subscribe to RSS Feed
- Permalink
- Report Inappropriate Content
Problem was with my expression used in Static Max to size the Y-axis.
I got confused since there are 5 expressions, fixed it using rangemax() function. It looks perfect now.
Thanks for the response and helpful ideas.