Unlock a world of possibilities! Login now and discover the exclusive benefits awaiting you.
- Qlik Community
- :
- All Forums
- :
- QlikView App Dev
- :
- Re: chart problem
- Subscribe to RSS Feed
- Mark Topic as New
- Mark Topic as Read
- Float this Topic for Current User
- Bookmark
- Subscribe
- Mute
- Printer Friendly Page
- Mark as New
- Bookmark
- Subscribe
- Mute
- Subscribe to RSS Feed
- Permalink
- Report Inappropriate Content
chart problem
hi i created a chart. and i added this code to
=class(floor((Today()-BirthDate)/365.25),$(agerange),'Age')
calculated dimension.
expression is sum(sales).
i created a slider and added a variable agerange.
but the result is nothing like this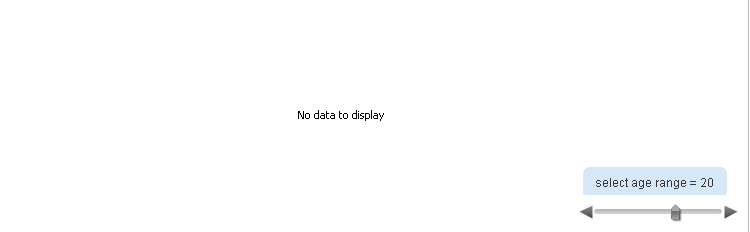
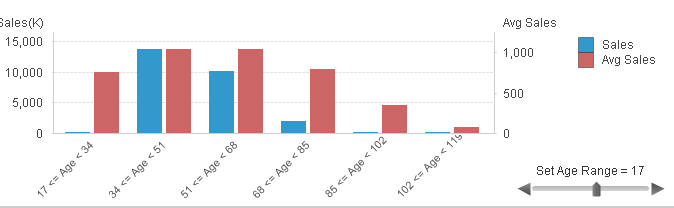
i need to display like this
- Tags:
- new_to_qlikview
- Mark as New
- Bookmark
- Subscribe
- Mute
- Subscribe to RSS Feed
- Permalink
- Report Inappropriate Content
hi
ya i noticed. different values in contact id. i think ur right. now display both values in the tables what should i do?
- Mark as New
- Bookmark
- Subscribe
- Mute
- Subscribe to RSS Feed
- Permalink
- Report Inappropriate Content
I found problem now...
If you check your HumanResource_Employee table... all ContactID starting with 4 digit
while in your orderheader table, all ContactID who are having at least something as TotalDue are not a single from HumanResource table.
You can check the same by creating a table box
of HumanResource_Employee and
orderheader
Check enclosed file....
- Mark as New
- Bookmark
- Subscribe
- Mute
- Subscribe to RSS Feed
- Permalink
- Report Inappropriate Content
hi.
thanks for ur reply. i noticed that. now display both values from two tables how can i do that?
- Mark as New
- Bookmark
- Subscribe
- Mute
- Subscribe to RSS Feed
- Permalink
- Report Inappropriate Content
I have already shown in the enclosed file in my previous reply.
New Sheet Object
Table Box
Select Table from Show Fields from Table
Add All (Dimensions)
Do the same for second table.
Now Select any ID from 1st Table, You will get no value in second table..
Hope you now get it what I am trying to tell you..
- Mark as New
- Bookmark
- Subscribe
- Mute
- Subscribe to RSS Feed
- Permalink
- Report Inappropriate Content
your chart is correct when you add the variable and adjust the source data
I tried with a binary load of your qvw and then I rebuild the HumanResources_Employee table
See attachment
- Mark as New
- Bookmark
- Subscribe
- Mute
- Subscribe to RSS Feed
- Permalink
- Report Inappropriate Content
sorry i cant able to open your file i am using personal edition. can u paste the code please...
thanks
- Mark as New
- Bookmark
- Subscribe
- Mute
- Subscribe to RSS Feed
- Permalink
- Report Inappropriate Content
hi Manish
sorry using personal edition...
- Mark as New
- Bookmark
- Subscribe
- Mute
- Subscribe to RSS Feed
- Permalink
- Report Inappropriate Content
copy your qvw in the same folder (Sale management 1.qvw)
modify Sales management 1.qvw
- binary load your sales management.qvw
- drop HumanResources_Employee
- rebuild HumanResources_Employee with a random birth date using ContactID from OrderHeader
this is the SCRIPT in Sale management 1.qvw
Binary [sale management.qvw];
SET ThousandSep=',';
SET DecimalSep='.';
SET MoneyThousandSep=',';
SET MoneyDecimalSep='.';
SET MoneyFormat='$#,##0.00;($#,##0.00)';
SET TimeFormat='h:mm:ss TT';
SET DateFormat='M/D/YYYY';
SET TimestampFormat='M/D/YYYY h:mm:ss[.fff] TT';
SET MonthNames='Jan;Feb;Mar;Apr;May;Jun;Jul;Aug;Sep;Oct;Nov;Dec';
SET DayNames='Mon;Tue;Wed;Thu;Fri;Sat;Sun';
DROP Table HumanResources_Employee;
HumanResources_Employee:
LOAD
ContactID,
floor(Today() -rand()*20000) as BirthDate;
;
Load distinct
ContactID
//BirthDate
Resident OrderHeader;
exit script;
- Mark as New
- Bookmark
- Subscribe
- Mute
- Subscribe to RSS Feed
- Permalink
- Report Inappropriate Content
thanks everyone.....
- Mark as New
- Bookmark
- Subscribe
- Mute
- Subscribe to RSS Feed
- Permalink
- Report Inappropriate Content
To sort the chart in proper order use below...
Change the dimension as below..
=DUAL(class(Floor((Today()-BirthDate)/365.25),$(agerange),'Age'),class(Floor((Today()-BirthDate)/365.25),$(agerange),'Age'))
Sort Tab
Numeric Value ==> Ascending order