Unlock a world of possibilities! Login now and discover the exclusive benefits awaiting you.
- Qlik Community
- :
- All Forums
- :
- QlikView App Dev
- :
- Re: chart with multiple line , how to make it mult...
- Subscribe to RSS Feed
- Mark Topic as New
- Mark Topic as Read
- Float this Topic for Current User
- Bookmark
- Subscribe
- Mute
- Printer Friendly Page
- Mark as New
- Bookmark
- Subscribe
- Mute
- Subscribe to RSS Feed
- Permalink
- Report Inappropriate Content
chart with multiple line , how to make it multiple color ?
Hi All
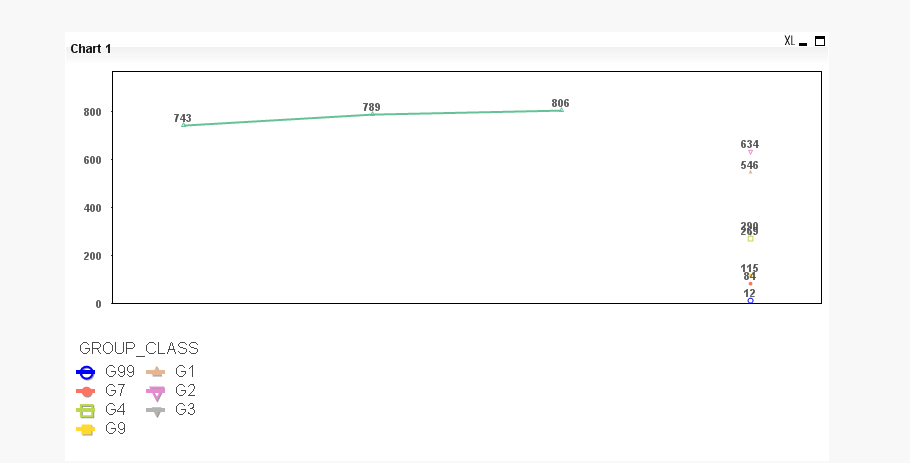
I have a chart with multiple line . the color of each line same color , how to make it diff color ?
i will enclosed my sample QV doc in my next post.
Paul
- Tags:
- qlikview_scripting
- « Previous Replies
-
- 1
- 2
- Next Replies »
Accepted Solutions
- Mark as New
- Bookmark
- Subscribe
- Mute
- Subscribe to RSS Feed
- Permalink
- Report Inappropriate Content
Hi Paul,
Legends are present in your chart, yo need to press shift+ctrl and drag the legend bar a little up.
Regards
KC
KC
- Mark as New
- Bookmark
- Subscribe
- Mute
- Subscribe to RSS Feed
- Permalink
- Report Inappropriate Content
Hi paul,
Prop->colors->
change the colors in that.
Regards,
Joshua
- Mark as New
- Bookmark
- Subscribe
- Mute
- Subscribe to RSS Feed
- Permalink
- Report Inappropriate Content
Hi,
goto the chart properties -> colors tab -> multicolored.
I have seen your graph, there is only one expression in it , you cannot different lines.
Thanks
Kiran
- Mark as New
- Bookmark
- Subscribe
- Mute
- Subscribe to RSS Feed
- Permalink
- Report Inappropriate Content
Hi Krian
Thank you for your sharing . I am
Not able to tick on multiple Color box as it is disable.
Yes I have only one expression , but the GROUP field have 10 line . I place this field as diamendion .
Any work around ?
Paul
Sent from my iPhone
- Mark as New
- Bookmark
- Subscribe
- Mute
- Subscribe to RSS Feed
- Permalink
- Report Inappropriate Content
Hi Paul,
The second dimension doesn't have any values I think that is the reason it is not showing up values(Lines).
Can you recheck your expression for the second dimension.
Thanks
Kiran Kumar
- Mark as New
- Bookmark
- Subscribe
- Mute
- Subscribe to RSS Feed
- Permalink
- Report Inappropriate Content
Hi Paul,
I this case you have to write an expression to set the color for each 10 line.
In dimension:
1.click on the + sign of group.
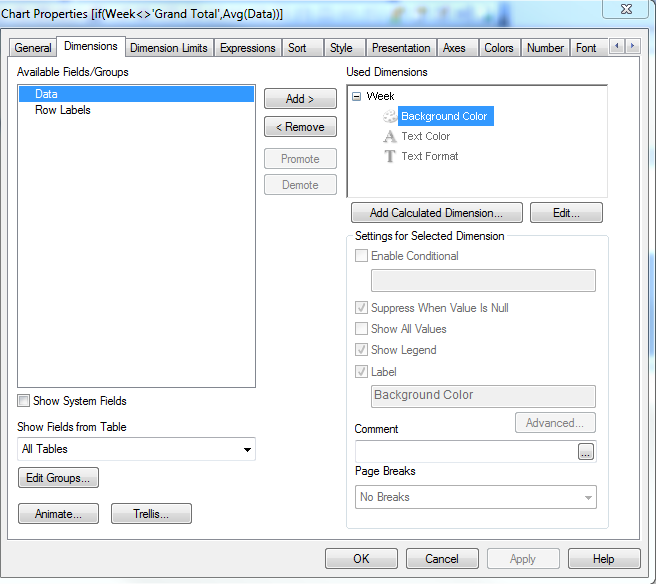
2. If(Group='ABC',rgb(10,1,21),if(Group='BCD',rgb(1,2,3)))
You can try like this.
Regards
KC
KC
- Mark as New
- Bookmark
- Subscribe
- Mute
- Subscribe to RSS Feed
- Permalink
- Report Inappropriate Content
Hi Sir
I try your script but the Color never change.
My field name GROUP_CLASS , label = G1 , I insert your example with my field name not working .
Paul
Sent from my iPhone
- Mark as New
- Bookmark
- Subscribe
- Mute
- Subscribe to RSS Feed
- Permalink
- Report Inappropriate Content
Hi ,
for bar chart left axis is there and for the line chart right axis is there.
do you have any relation between them if yes then it will be easy to write the condition for background color.
Regards
Rajesh Kumar
- Mark as New
- Bookmark
- Subscribe
- Mute
- Subscribe to RSS Feed
- Permalink
- Report Inappropriate Content
Hi Paul,
Can you share a sample app ? That will be helpful to understand.
Regards
Jyothish KC
KC
- Mark as New
- Bookmark
- Subscribe
- Mute
- Subscribe to RSS Feed
- Permalink
- Report Inappropriate Content
Hi KC
I Have enclosed the QV sample file at 2 posting.
Paul
Sent from my iPhone
- « Previous Replies
-
- 1
- 2
- Next Replies »