Unlock a world of possibilities! Login now and discover the exclusive benefits awaiting you.
- Qlik Community
- :
- All Forums
- :
- QlikView App Dev
- :
- charts - excel, qlikview and crosstabs
- Subscribe to RSS Feed
- Mark Topic as New
- Mark Topic as Read
- Float this Topic for Current User
- Bookmark
- Subscribe
- Mute
- Printer Friendly Page
- Mark as New
- Bookmark
- Subscribe
- Mute
- Subscribe to RSS Feed
- Permalink
- Report Inappropriate Content
charts - excel, qlikview and crosstabs
Hi,
Hoping people can just clarify a few things.
People kindly provided a solution; however, don't fully understand it nor can I replicate. The solution provided involved the use of cross tabs.
On the attached app I want to keep the straight table as is which shows costs per month. However, on the chart I need to be able to a) be able to replicate this by having a line chart - a line for each service area and crucially the axis being the month - see how it works in excel:
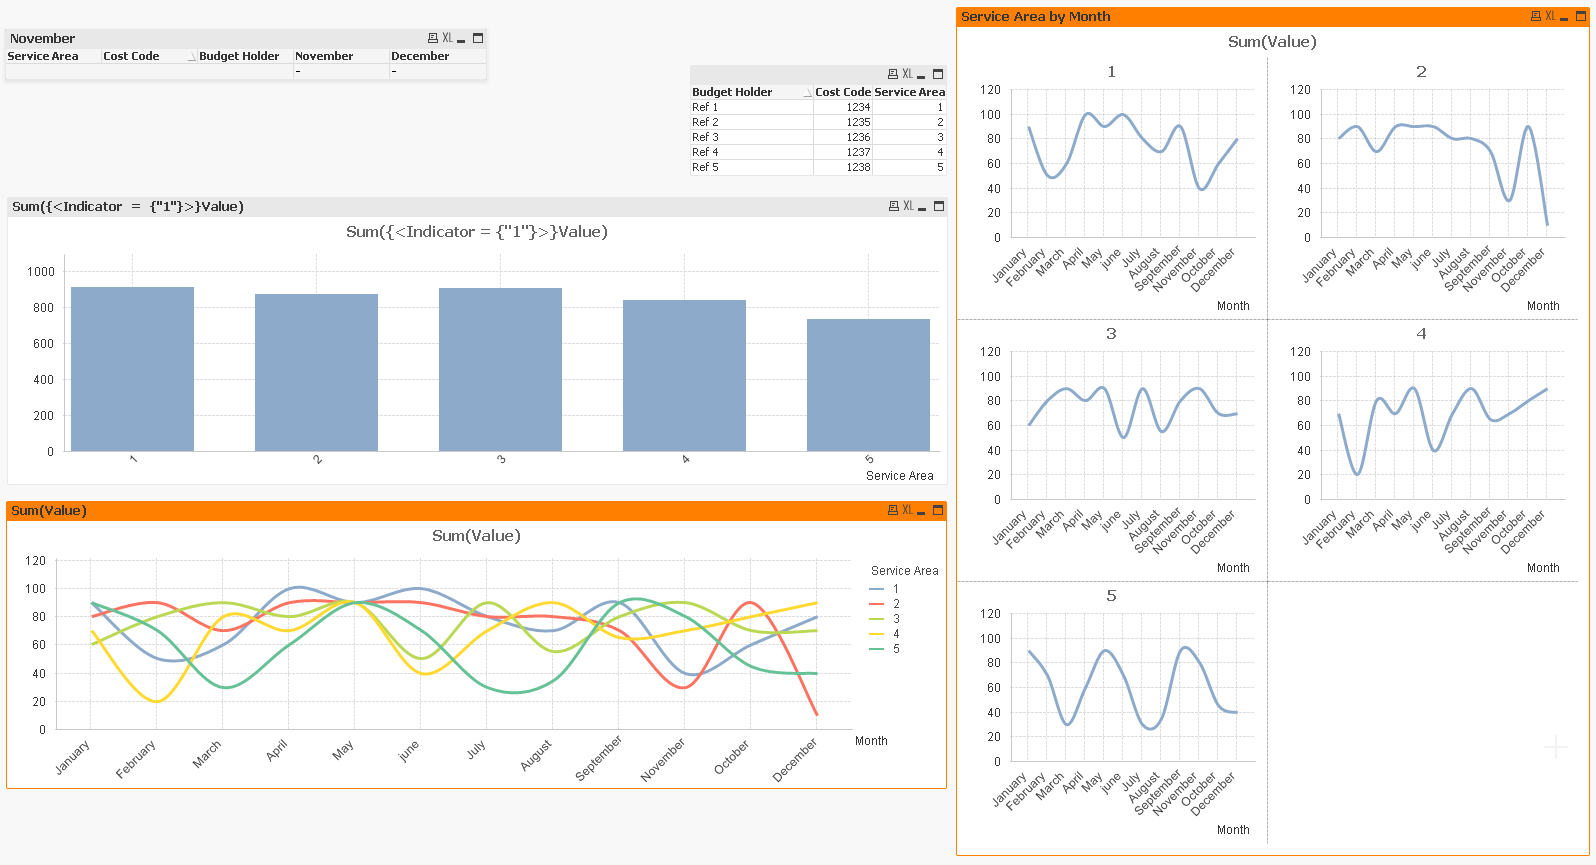
b) be then able to show separate chart for each service area. So having 5 charts showing respective costs through the year.
Crosstabs - as mentioned this seems to be the key to delivering correct chart (CrossTable(Month, Value)); however, this then messes up the data on the table due to the format it goes into - it loses the month.
Any help would be greatly appreciated.
Chris
- Tags:
- new_to_qlikview
Accepted Solutions
- Mark as New
- Bookmark
- Subscribe
- Mute
- Subscribe to RSS Feed
- Permalink
- Report Inappropriate Content
Try this:
 !
!
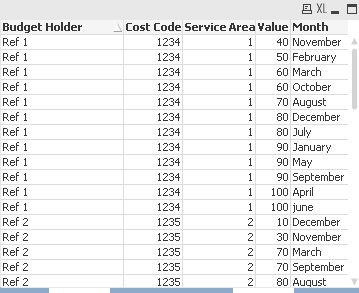
I modified your load script to sort and rename your fields, to create a dimension Month with your field January..December
CrossTable(Month, Value, 3)
LOAD [Budget Holder],
[Cost Code],
[Service Area],
January,
February,
[March/Q4] as March,
April,
May,
[June/Q1] as june,
July,
August,
September,
November,
October,
December
FROM
(ooxml, embedded labels, table is Sheet1);
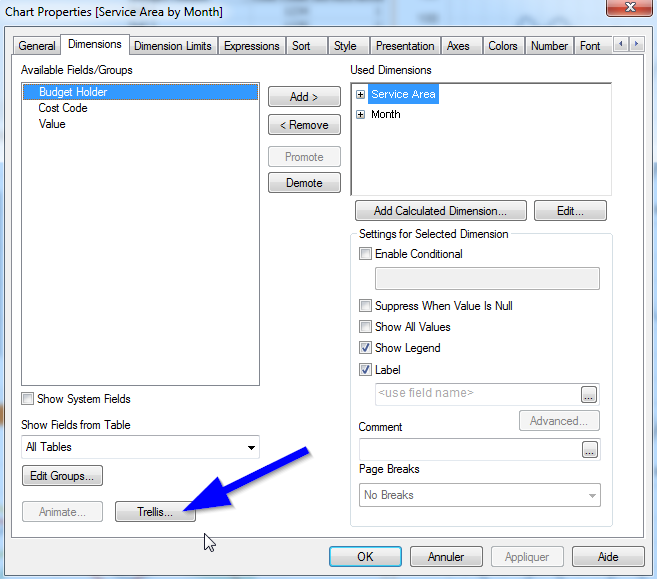
I use th trellis in the second chart to display each service individualy.
- Mark as New
- Bookmark
- Subscribe
- Mute
- Subscribe to RSS Feed
- Permalink
- Report Inappropriate Content
May be like the attached one?
- Mark as New
- Bookmark
- Subscribe
- Mute
- Subscribe to RSS Feed
- Permalink
- Report Inappropriate Content
Load the data like this:
T_Table:
CrossTable(T_Period, Value, 3)
LOAD *
FROM
(ooxml, embedded labels, table is Sheet1);

Table:
LOAD *,
  Dual(Left(MonthName, 3), (Index(MonthNames, Left(MonthName, 3)) - 1) / 3) As Period
;
LOAD [Budget Holder],
  [Cost Code],
  [Service Area],
  If(Left(T_Period = '['),
  SubField(Mid(T_Period, 2, 999), '/', 1),
  T_Period
  ) As MonthName,
  Value
Resident T_Table;

DROP Table T_Table;
Now Period contains a dual month variable and MonthName contains a text monthe name. Period will sort correctly and (numerical sort), and you can use this as a dimension.
- Mark as New
- Bookmark
- Subscribe
- Mute
- Subscribe to RSS Feed
- Permalink
- Report Inappropriate Content
It seems you are spanning more than one year. To handle this correctly, you may want a Year field and/or a month sequence number field. Does the filename contain the year(s) (15-16)?
- Mark as New
- Bookmark
- Subscribe
- Mute
- Subscribe to RSS Feed
- Permalink
- Report Inappropriate Content
This code:
T_Table:
CrossTable(T_Period, Value, 4)
LOAD FileBaseName() As File,
  *
FROM
(ooxml, embedded labels, table is Sheet1);


Table:
LOAD [Budget Holder],
  [Cost Code],
  [Service Area],
  Year,
  MonthName,
  Dual(Text(Period), (Year-2000) * 12 + Period) As Period,   // correct fiscal sorting
  Value
;
LOAD *,
  If(Period < 4, T_Year, T_Year + 1) As Year
;
LOAD *,
  Dual(MonthName, (Index(MonthNames, Left(T_Period, 3)) - 1) / 4 + 1) As Period   // lookup month #
;
LOAD [Budget Holder],
  [Cost Code],
  [Service Area],
  If(Left(T_Period = '['),
  SubField(Mid(T_Period, 2, 999), '/', 1),
  T_Period
  ) As MonthName,
  Value,
  2000 + Left(SubField(File, ' ', 3), 2) As T_Year
Resident T_Table;


DROP Table T_Table;
will ensure that the Period field displays the Month but sorts in the correct fiscal order. Line 32 parses the year from the file name, which may require changes if the file name in your post is not representative. This script uses the MonthNames environment variable to convert the month name into a dual field.
- Mark as New
- Bookmark
- Subscribe
- Mute
- Subscribe to RSS Feed
- Permalink
- Report Inappropriate Content
Try this:
!
I modified your load script to sort and rename your fields, to create a dimension Month with your field January..December
CrossTable(Month, Value, 3)
LOAD [Budget Holder],
[Cost Code],
[Service Area],
January,
February,
[March/Q4] as March,
April,
May,
[June/Q1] as june,
July,
August,
September,
November,
October,
December
FROM
(ooxml, embedded labels, table is Sheet1);
I use th trellis in the second chart to display each service individualy.
- Mark as New
- Bookmark
- Subscribe
- Mute
- Subscribe to RSS Feed
- Permalink
- Report Inappropriate Content
Hi,
Thanks for all these but I really don't like how it changes the straight or table box and displays is like this:
Is it not possible to maintain format of this before a crosstable is added? like so:
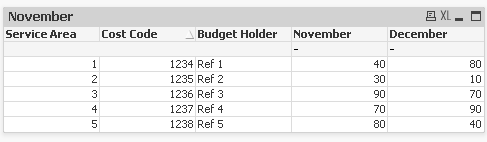
Chris
- Mark as New
- Bookmark
- Subscribe
- Mute
- Subscribe to RSS Feed
- Permalink
- Report Inappropriate Content
Use a pivot table rather than a straight table and drag the Month dimension to the top of the table.