Unlock a world of possibilities! Login now and discover the exclusive benefits awaiting you.
- Qlik Community
- :
- All Forums
- :
- QlikView App Dev
- :
- Re: circular loop
- Subscribe to RSS Feed
- Mark Topic as New
- Mark Topic as Read
- Float this Topic for Current User
- Bookmark
- Subscribe
- Mute
- Printer Friendly Page
- Mark as New
- Bookmark
- Subscribe
- Mute
- Subscribe to RSS Feed
- Permalink
- Report Inappropriate Content
circular loop
Anybody tell me how to convert from pie chart to stacked bar chart using circular loop in qlik view..its urgent..
Regards,
Praveen Kumar S
- Mark as New
- Bookmark
- Subscribe
- Mute
- Subscribe to RSS Feed
- Permalink
- Report Inappropriate Content
What I know is that ,
If you click on cyclic group icon , The dimensions will change. The type of chart won't change.
To change the type of your graph, after selecting Fast change option, you get an icon like this -->  on your chart.
Click on this icon to change the type of your chart.
Try and let me know if this is what you are looking for. And if not then just attach an image for the same.
Regards,
Varsha
- Mark as New
- Bookmark
- Subscribe
- Mute
- Subscribe to RSS Feed
- Permalink
- Report Inappropriate Content
i have done what you told previously and i have got it.but same dimension can be used.i want to use different dimension mam, thatswhy ...
Thanks,
Praveen Kumar S
- Mark as New
- Bookmark
- Subscribe
- Mute
- Subscribe to RSS Feed
- Permalink
- Report Inappropriate Content
As far as I know, we cannot use "fast type change" with different set of dimension for each type.
A container object can help you for this.
- Mark as New
- Bookmark
- Subscribe
- Mute
- Subscribe to RSS Feed
- Permalink
- Report Inappropriate Content
oh...its k..if there is any extension object do this..? pls let me know mam...
Regards,
Praveen Kumar S
- Mark as New
- Bookmark
- Subscribe
- Mute
- Subscribe to RSS Feed
- Permalink
- Report Inappropriate Content
Hi Praveen Kumar,
If you want to convert stacked bar means you should have more than one expression used in your chart. Then you can convert to Stacked Bar chart from pie.
Thanks&Regards
Hita
- Mark as New
- Bookmark
- Subscribe
- Mute
- Subscribe to RSS Feed
- Permalink
- Report Inappropriate Content
Hi Hita,
Pls explain clearly..i have done that using Fast change told by varsha mam, but i want to do it using circular loop using different dimensions. pls let me know
Thanks,
Praveen Kumar S
- Mark as New
- Bookmark
- Subscribe
- Mute
- Subscribe to RSS Feed
- Permalink
- Report Inappropriate Content
Well, I'm not aware of any such extension object.
For a workaround,
1. You can use container object
2. Chart - Show/ hide option
3. pick metrics <<--- depends upon your requirement.
- Mark as New
- Bookmark
- Subscribe
- Mute
- Subscribe to RSS Feed
- Permalink
- Report Inappropriate Content
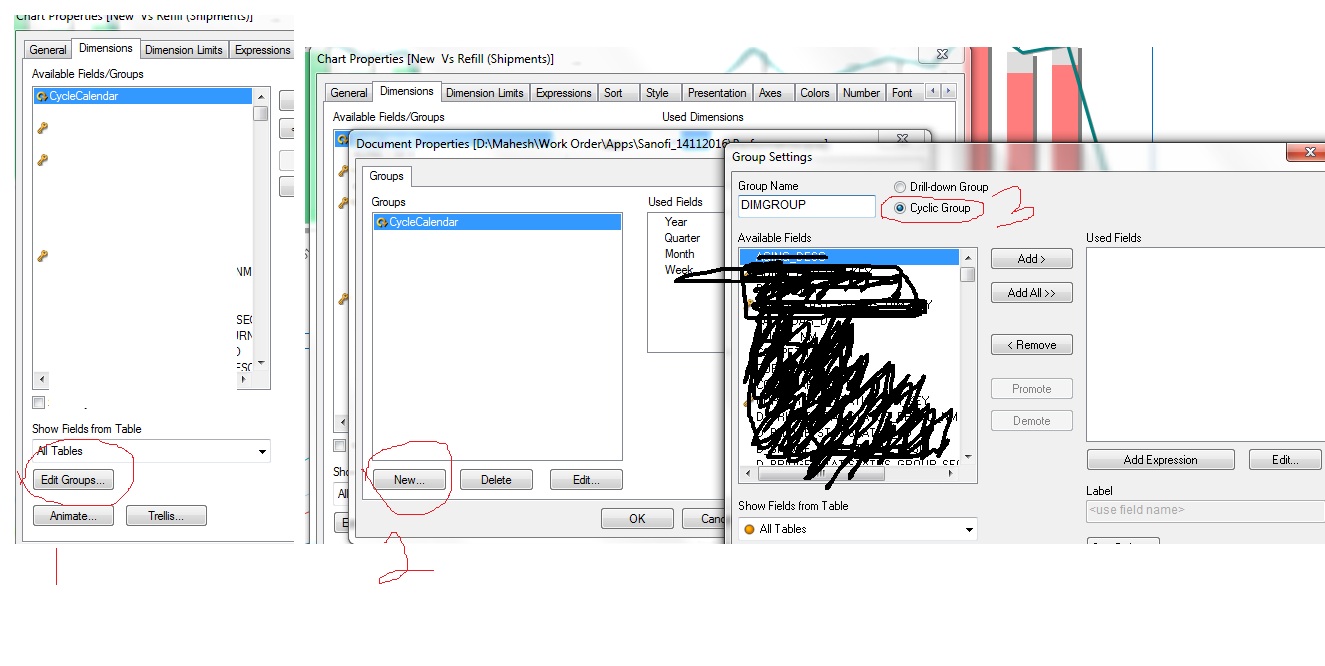
Hey Go to Chart Dimensions Tab, Follow the below steps, add dimensions you want, then click ok
- Mark as New
- Bookmark
- Subscribe
- Mute
- Subscribe to RSS Feed
- Permalink
- Report Inappropriate Content
Please simply call me Varsha. 
- Mark as New
- Bookmark
- Subscribe
- Mute
- Subscribe to RSS Feed
- Permalink
- Report Inappropriate Content
I think it's not circular loop, circular group...!