Unlock a world of possibilities! Login now and discover the exclusive benefits awaiting you.
- Qlik Community
- :
- All Forums
- :
- QlikView App Dev
- :
- class interval sorting
- Subscribe to RSS Feed
- Mark Topic as New
- Mark Topic as Read
- Float this Topic for Current User
- Bookmark
- Subscribe
- Mute
- Printer Friendly Page
- Mark as New
- Bookmark
- Subscribe
- Mute
- Subscribe to RSS Feed
- Permalink
- Report Inappropriate Content
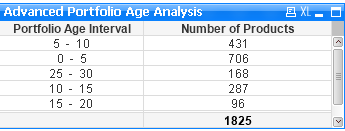
class interval sorting
I have created the following chart using the class function:
The calculated dimension and expression for the table are as follows;

How can the table be sorted properly starting with lower age intervals:
0 - 5
5 - 10
10 - 15 etc
regards.
Chris
Accepted Solutions
- Mark as New
- Bookmark
- Subscribe
- Mute
- Subscribe to RSS Feed
- Permalink
- Report Inappropriate Content
Use this expression as calculated dimension
=Dual(Replace(Aggr(Class(Count(Distinct PortfolioAge),5), MCAZApplicant), '<= x <', ' -'),Aggr(Class(Count(Distinct PortfolioAge),5), MCAZApplicant))
Go to sort tab and sort by numeric Value.
- Mark as New
- Bookmark
- Subscribe
- Mute
- Subscribe to RSS Feed
- Permalink
- Report Inappropriate Content
Can you try using Dual() function:
=Dual(Replace(Aggr(Class(Count(DISTINCT PortfolioAge), 5), MCAZApplicant), '<= x <', ' - '), Aggr(Class(Count(DISTINCT PortfolioAge), 5), MCAZApplicant))
and then sort your dimension numeric ascending.
- Mark as New
- Bookmark
- Subscribe
- Mute
- Subscribe to RSS Feed
- Permalink
- Report Inappropriate Content
Many thanks Manish
- Mark as New
- Bookmark
- Subscribe
- Mute
- Subscribe to RSS Feed
- Permalink
- Report Inappropriate Content
Thank you Sunny