Unlock a world of possibilities! Login now and discover the exclusive benefits awaiting you.
- Qlik Community
- :
- All Forums
- :
- QlikView App Dev
- :
- Re: combined graph
- Subscribe to RSS Feed
- Mark Topic as New
- Mark Topic as Read
- Float this Topic for Current User
- Bookmark
- Subscribe
- Mute
- Printer Friendly Page
- Mark as New
- Bookmark
- Subscribe
- Mute
- Subscribe to RSS Feed
- Permalink
- Report Inappropriate Content
combined graph
Goodmorning everyone
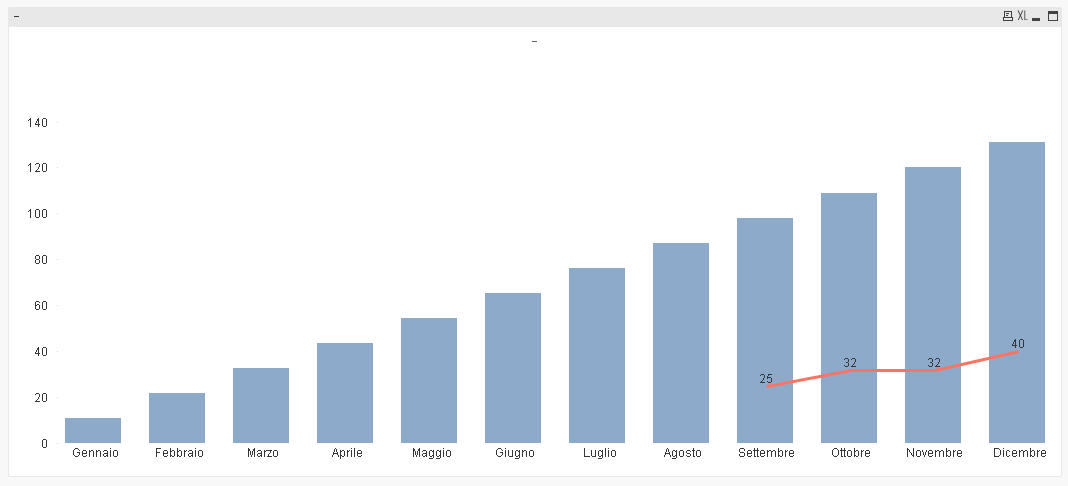
attached an example of a dashboard that would like to achieve
for convenience I imported the database directly in the script via the load inline.
the obbettivo is to represent a combined graph with the trend with the ratio of the budget and purchases.
the budget year is distributed under the budget for the current month (in this case (11/2015) divided the month to month value.
purchases must instead be represented by retrieving data from the purchases table but is valued only for a few months
what I want to achieve is a similar result to the one shown in the figure, with both representations
Thanks to all for your cooperation
Andrea
- « Previous Replies
-
- 1
- 2
- Next Replies »
Accepted Solutions
- Mark as New
- Bookmark
- Subscribe
- Mute
- Subscribe to RSS Feed
- Permalink
- Report Inappropriate Content
Besides not know what the sales field is, the bigger issue is that your tables are not connected to each other.
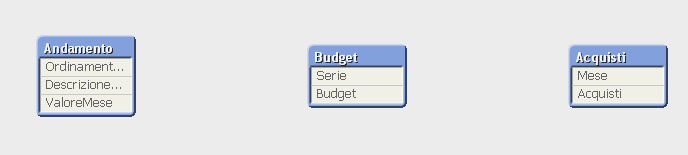
One a similar post by you, I did provide a solution, where I connected the two tables so that on a single chart you are able to see the result you are hoping to see (Re: graphic Mixed)
Isn't this the same thing you are trying to do?
- Mark as New
- Bookmark
- Subscribe
- Mute
- Subscribe to RSS Feed
- Permalink
- Report Inappropriate Content
I don't see Vendite in the attached application?
- Mark as New
- Bookmark
- Subscribe
- Mute
- Subscribe to RSS Feed
- Permalink
- Report Inappropriate Content
I do not have the sales 2 graphics should represent the budget divided for months according to the formula specified in the instrument panel and purchases
I put databases on script using load inline
- Mark as New
- Bookmark
- Subscribe
- Mute
- Subscribe to RSS Feed
- Permalink
- Report Inappropriate Content
you're right in the second formula should be written on (buying) and sum (sales), but even so you see a single line width distributed throughout the year.
- Mark as New
- Bookmark
- Subscribe
- Mute
- Subscribe to RSS Feed
- Permalink
- Report Inappropriate Content
What is sales field name referred in your app?
- Mark as New
- Bookmark
- Subscribe
- Mute
- Subscribe to RSS Feed
- Permalink
- Report Inappropriate Content
Besides not know what the sales field is, the bigger issue is that your tables are not connected to each other.
One a similar post by you, I did provide a solution, where I connected the two tables so that on a single chart you are able to see the result you are hoping to see (Re: graphic Mixed)
Isn't this the same thing you are trying to do?
- Mark as New
- Bookmark
- Subscribe
- Mute
- Subscribe to RSS Feed
- Permalink
- Report Inappropriate Content
where the field on which to do the expression for the second graph is Buying
attached the correct example
- Mark as New
- Bookmark
- Subscribe
- Mute
- Subscribe to RSS Feed
- Permalink
- Report Inappropriate Content
I tried with the solution that I had proposed but is in script and I can not apply it.
you can not resolve it at the level of expression on the graphical object?
- Mark as New
- Bookmark
- Subscribe
- Mute
- Subscribe to RSS Feed
- Permalink
- Report Inappropriate Content
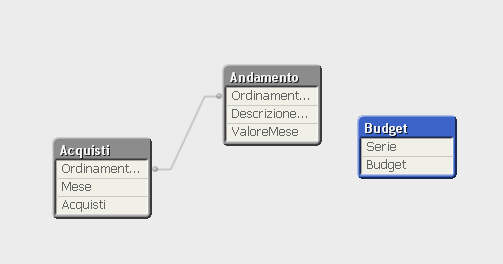
New Data Model:
Output Required:
- Mark as New
- Bookmark
- Subscribe
- Mute
- Subscribe to RSS Feed
- Permalink
- Report Inappropriate Content
I can try it now because you did not mention this before.
- « Previous Replies
-
- 1
- 2
- Next Replies »