Unlock a world of possibilities! Login now and discover the exclusive benefits awaiting you.
- Qlik Community
- :
- All Forums
- :
- QlikView App Dev
- :
- combining 3 charts into one
- Subscribe to RSS Feed
- Mark Topic as New
- Mark Topic as Read
- Float this Topic for Current User
- Bookmark
- Subscribe
- Mute
- Printer Friendly Page
- Mark as New
- Bookmark
- Subscribe
- Mute
- Subscribe to RSS Feed
- Permalink
- Report Inappropriate Content
combining 3 charts into one
Hi Geniuses,
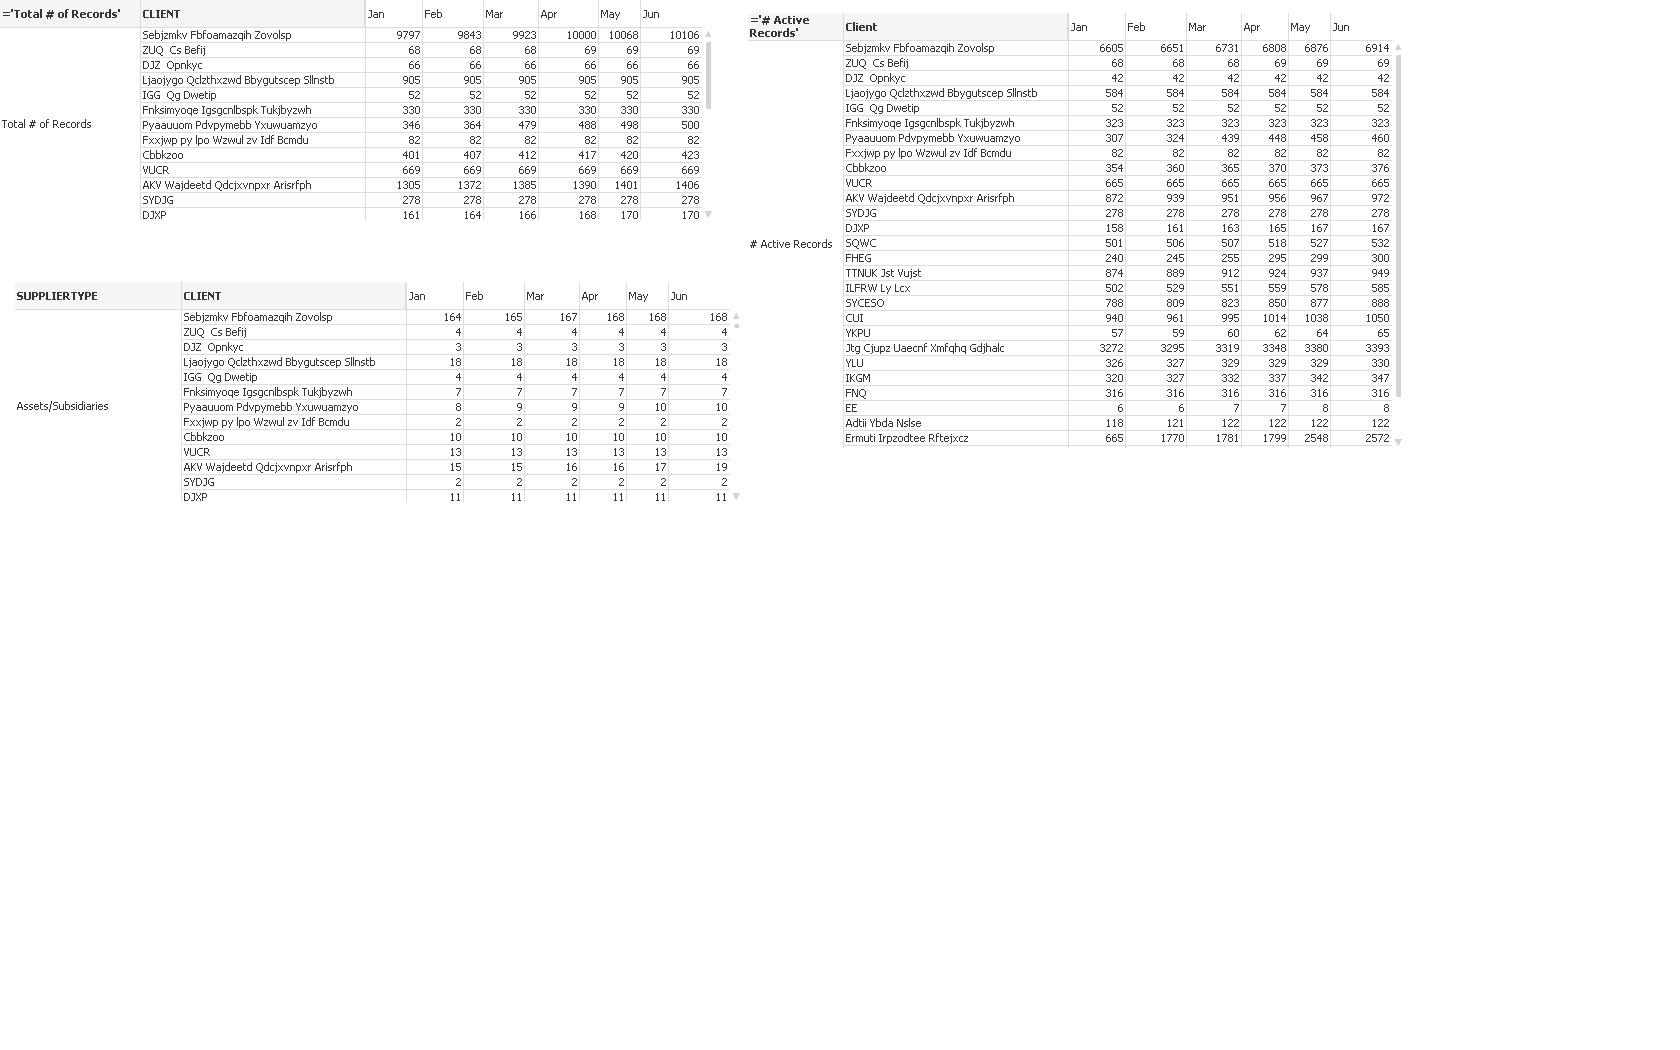
I have 3 charts like below

The dimensions of the first chart is 'Total Number of records'(hardcoded) and client
The dimensions of the Second chart is 'Active Number of records'(hardcoded) and client
The dimensions of the Third chart is Supplier Type and client
All the three charts have different formulas to calculate the data
now what i want is to merge all these 3 charts into 1 pivot table
Is it possible
please help me.
Thanks,
S
- Mark as New
- Bookmark
- Subscribe
- Mute
- Subscribe to RSS Feed
- Permalink
- Report Inappropriate Content
Can you please provide some sample data or sample application , so that it will be very easy to help you.
Else you need to perfect your data model first , then you can do this.
- Mark as New
- Bookmark
- Subscribe
- Mute
- Subscribe to RSS Feed
- Permalink
- Report Inappropriate Content
You could use a cyclic dimension group: Did you know..? Cyclic Group
- Marcus
- Mark as New
- Bookmark
- Subscribe
- Mute
- Subscribe to RSS Feed
- Permalink
- Report Inappropriate Content
Simply create a new cyclic group:
Go to:
Properties
Dimensions
Edit groups
Create a 'new' group and select 'cyclic' group
add your dimensions i.e first dimension of all the three charts.
---------------------------------