Unlock a world of possibilities! Login now and discover the exclusive benefits awaiting you.
- Qlik Community
- :
- All Forums
- :
- QlikView App Dev
- :
- combo chart problem
- Subscribe to RSS Feed
- Mark Topic as New
- Mark Topic as Read
- Float this Topic for Current User
- Bookmark
- Subscribe
- Mute
- Printer Friendly Page
- Mark as New
- Bookmark
- Subscribe
- Mute
- Subscribe to RSS Feed
- Permalink
- Report Inappropriate Content
combo chart problem
Hi all,
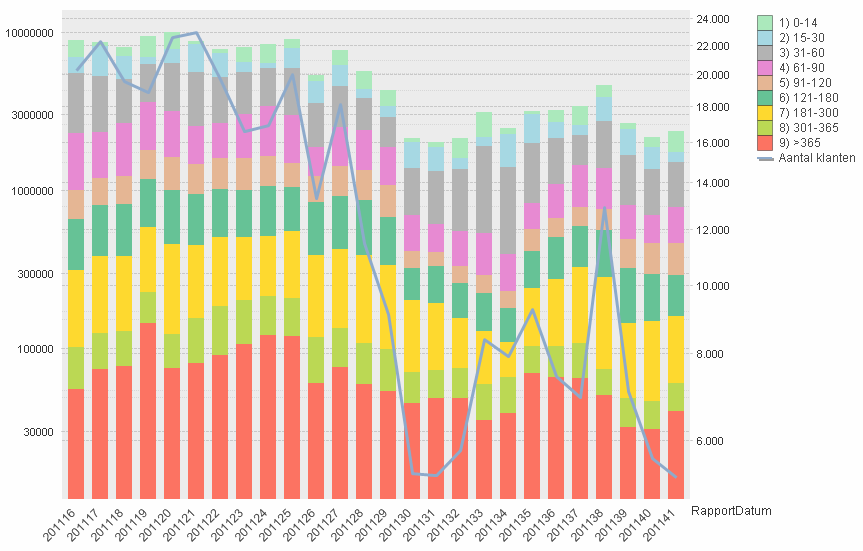
I am new with qlikview and a little bit stuck with the next problem. I have a table with fields that represent outstanding debt bucket.
Every bucket is one field in the table.
9 buckets and a customer field (Aantal klanten). The problem is how to show this in a combochart ? At the moment i made for every bucket an expression and the final result you can see here on the screenshot.
The only problem i have now that a would love to have those buckets also in a listbox so that it is possible to select every bucket so as the client wishes.
Also it is not possible for me at the moment to reload the loadscript because only developers may do that here at my work 😞 And because i am new....it will take some time before i can do that. Is there someone who has some tips or tricks for me to accomplish what i want to do ? Or has another methode get the same result as in the screenshot in combination with a listbox ?
Thanks in advance
- Mark as New
- Bookmark
- Subscribe
- Mute
- Subscribe to RSS Feed
- Permalink
- Report Inappropriate Content
As you can't reload you're going to be a little constrained in what you can do. The area I'd start looking at are the functions valueloop() and valuelist() - they allow you to generate synthetic dimensions to populate dimensions and Listboxes.
If you can't get anywhere try posting an example file and I may be able to assist further.
All the best,
Matt - Visual Analytics Ltd
- Mark as New
- Bookmark
- Subscribe
- Mute
- Subscribe to RSS Feed
- Permalink
- Report Inappropriate Content
You are right...i know....hope they change that on short notice, that will make it a lot easier for me.
An example file will be difficult at the moment.
But meanwhile i had done the next steps.
As Dimension i made a valuelist with al the buckets and as expression for the chart i created for each bucket a seperate one that gives a sum of the specific bucket...that gives the result as shown in the screenshot but i miss the possibility to choose more than one bucket via a listbox. I tried to use an expression in the listbox properties with the same valuelist as used as an dimension in the chart but this doesn't work.