Unlock a world of possibilities! Login now and discover the exclusive benefits awaiting you.
- Qlik Community
- :
- All Forums
- :
- QlikView
- :
- combo chart with group dimension
- Subscribe to RSS Feed
- Mark Topic as New
- Mark Topic as Read
- Float this Topic for Current User
- Bookmark
- Subscribe
- Mute
- Printer Friendly Page
- Mark as New
- Bookmark
- Subscribe
- Mute
- Subscribe to RSS Feed
- Permalink
- Report Inappropriate Content
combo chart with group dimension
Hi Experts,
Is there any way to create a combo chart with cycle group dimensions?
For Example,
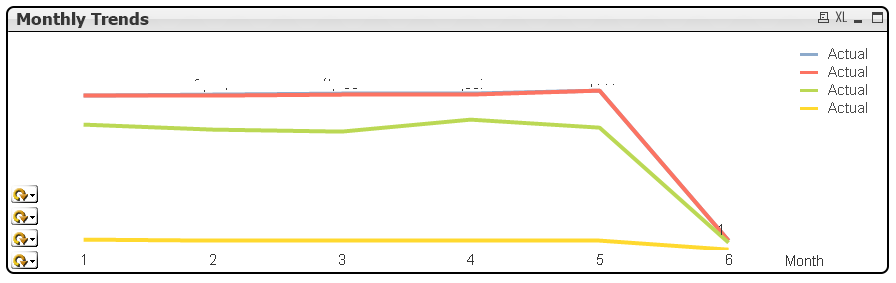
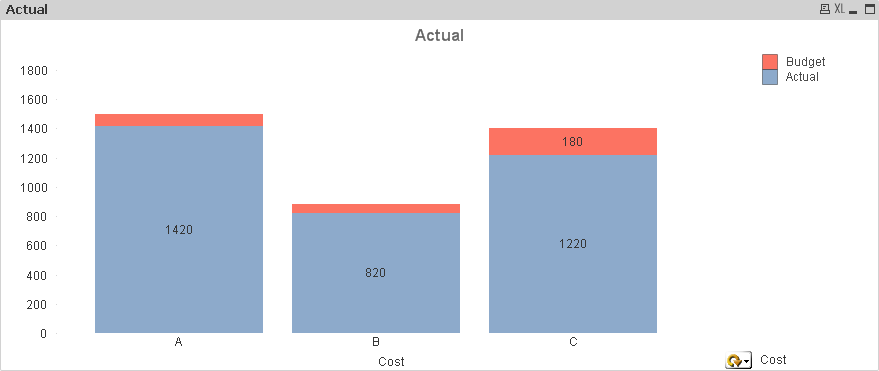
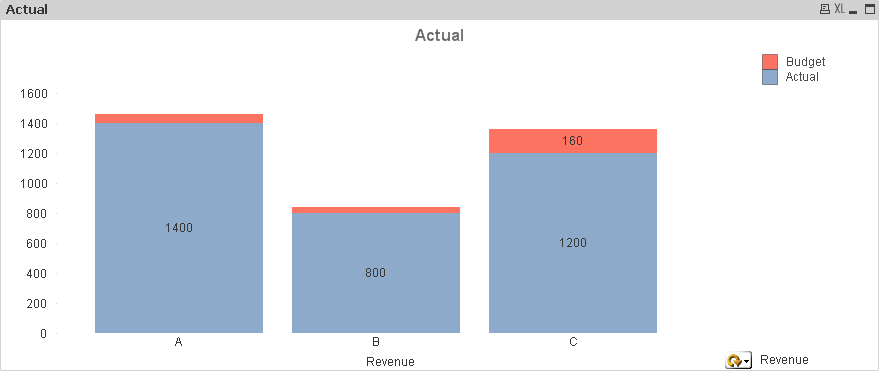
Here's a combo chart of Revenues with "Actual" line, "Budget" line and "Diff" bar as attached image, and I'm wondering if there's any way to change the data from Revenues to Cost by using Cycle Group?
Thanks a lot!
- Mark as New
- Bookmark
- Subscribe
- Mute
- Subscribe to RSS Feed
- Permalink
- Report Inappropriate Content
Hi,
You can try Group option available in expressions. Still need to figure out how to group them.

Regards,
Neha
- Mark as New
- Bookmark
- Subscribe
- Mute
- Subscribe to RSS Feed
- Permalink
- Report Inappropriate Content
Hi Kate,
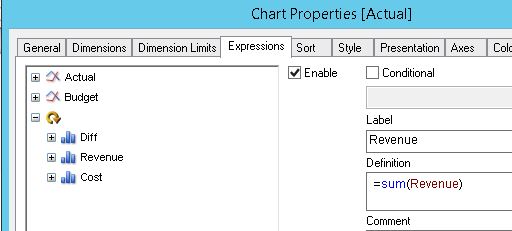
I think Neha has given you the correct answer. The way to group the expressions is follows. In the Expressions tab of you chart click on any expression in your list except the first one. the Group button will become active and if you click it the expression you have clicked on will join with the one above and form a group. If there is an expression above the group clicking the Group button again will join the group with the expression above to form a new group of three expressions. clicking on a group will make the Ungroup button become active so you can seperate out the expressions if you wish.
Regards
Andrew
- Mark as New
- Bookmark
- Subscribe
- Mute
- Subscribe to RSS Feed
- Permalink
- Report Inappropriate Content
Hi Neha and Andrew,
Thanks for your reply.
I've already tried to use the group option in Expression, and it shows multiple cyclic group icons as below neither I grouped by Actual, budget and Diff nor Revenues, Cost, Expense..etc.
As Neha said, still need to figure out how to group them.
- Mark as New
- Bookmark
- Subscribe
- Mute
- Subscribe to RSS Feed
- Permalink
- Report Inappropriate Content
Create the cyclic group of the Bar expression and keep the line expression as it is
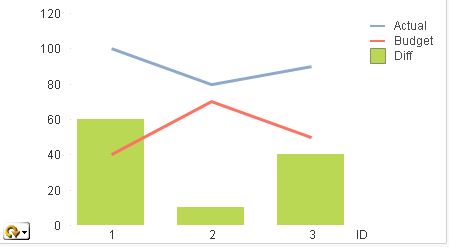
You can change the cyclic group expression now
- Mark as New
- Bookmark
- Subscribe
- Mute
- Subscribe to RSS Feed
- Permalink
- Report Inappropriate Content
Hi
Drill-down & Cyclic group
Has been Used in Combo Chart which is Shown in Snapshot
Regards
Tahemas Momin
- Mark as New
- Bookmark
- Subscribe
- Mute
- Subscribe to RSS Feed
- Permalink
- Report Inappropriate Content
You want to group a set of expressions for the cyclic selection right? if so Create a cyclic group of the column Categ,Categ1 and use the below expression
LOAD * Inline [
Categ , Categ1
Revenue , Cost
];
LOAD * Inline [
Dim,Value1,Value2
A,700,30
B,400,20
C,600,80
A,700,30
B,400,20
C,600,80
];
Dimension: Dim, CyclicGroup
Expression: if(GetCurrentField("Category")='Categ', sum(Value1) ,sum(Value1)+20)
if(GetCurrentField("Category")='Categ', sum(Value2) ,sum(Value2)+20)
- Mark as New
- Bookmark
- Subscribe
- Mute
- Subscribe to RSS Feed
- Permalink
- Report Inappropriate Content
Hello,
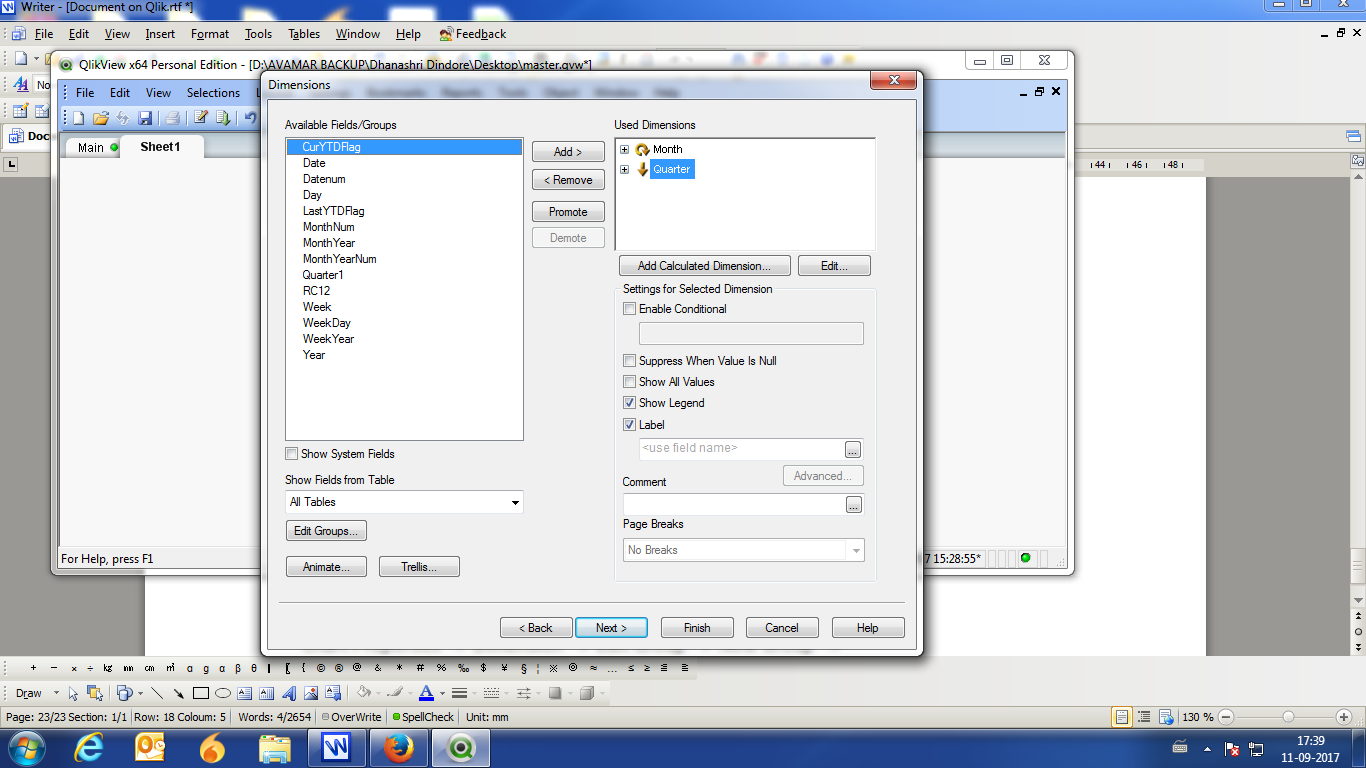
If you want to use it for dimensions then: in chart properties: Dimensions-> edit groups -> new -> cyclic -> name of it and the fields
For expressions let's say you have 3: you can group the second with the first and to group the third just select it and click group and it will be added to already made group.
Hope it helps,
Andrei
- Mark as New
- Bookmark
- Subscribe
- Mute
- Subscribe to RSS Feed
- Permalink
- Report Inappropriate Content
Hi Experts,
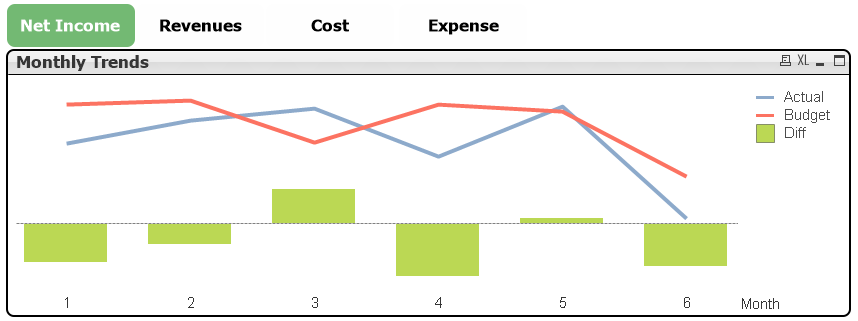
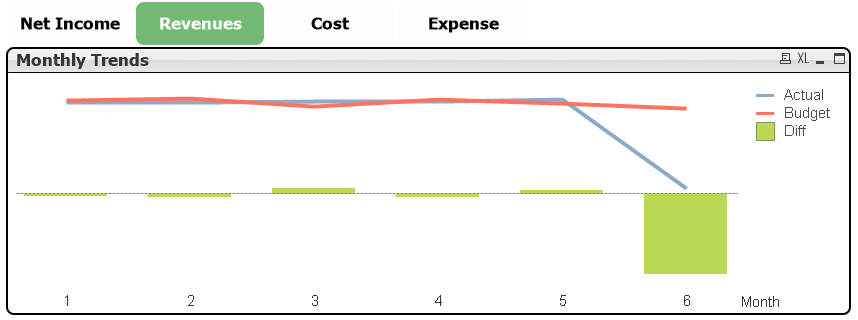
Sorry, I may not describe my question clearly. I want to create a combo chart with cyclic group which can display three different value of "Actual", "Budget" and "Diff" when user click on the group to switch the selection from 「Net Income」to 「Revenues」/「Cost」/「Expense」. The values of two lines and bar should be changed as well.
Below image is the alternative way I can do so far. If there's any better way, please don't hesitate to share with me. Thanks a lot!
- Mark as New
- Bookmark
- Subscribe
- Mute
- Subscribe to RSS Feed
- Permalink
- Report Inappropriate Content
what is Actual, budget and Diff for Net income and revenue? How actual and budget changes?