Unlock a world of possibilities! Login now and discover the exclusive benefits awaiting you.
- Qlik Community
- :
- All Forums
- :
- QlikView App Dev
- :
- complex heat map
- Subscribe to RSS Feed
- Mark Topic as New
- Mark Topic as Read
- Float this Topic for Current User
- Bookmark
- Subscribe
- Mute
- Printer Friendly Page
- Mark as New
- Bookmark
- Subscribe
- Mute
- Subscribe to RSS Feed
- Permalink
- Report Inappropriate Content
complex heat map
Hi,
I have a mental picture of how to make a cool heat map - I made it in Excel but have no idea whether QV will support it. Attached on the first page is the excel data (both raw and relative). The second page is the desired output. The third page is a matrix convert of the raw data so that QV will read it.
Does anyone know whether this is feasible in QV?
Thanks!
- « Previous Replies
- Next Replies »
Accepted Solutions
- Mark as New
- Bookmark
- Subscribe
- Mute
- Subscribe to RSS Feed
- Permalink
- Report Inappropriate Content
Yes, you need to check the box that says 'Suppress when value is null' for that dimension.
- Mark as New
- Bookmark
- Subscribe
- Mute
- Subscribe to RSS Feed
- Permalink
- Report Inappropriate Content
- Mark as New
- Bookmark
- Subscribe
- Mute
- Subscribe to RSS Feed
- Permalink
- Report Inappropriate Content
See attached.
- Mark as New
- Bookmark
- Subscribe
- Mute
- Subscribe to RSS Feed
- Permalink
- Report Inappropriate Content
that's insanely cool that you did that so fast!! I'll try to replicate with my full data set and hopefully it will work. I will let you know if it does  Thank you both for your help!
- Mark as New
- Bookmark
- Subscribe
- Mute
- Subscribe to RSS Feed
- Permalink
- Report Inappropriate Content
Ok, it's coming together really well but I still have a couple of problems:
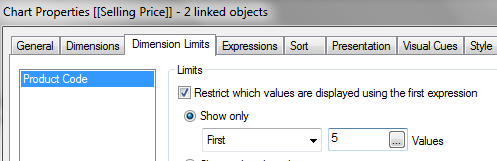
1. I have 2000 buyers in my real data set - I only want to show the top 5 by total discretionary spend.. is there a way to do that in this pivot?
2. I have 89 expenses in my real data set - I only want to show specific ones. Is there a way to filter the pivot to only show the ones I want to show?
Again - this is the coolest chart - thanks so much!
- Mark as New
- Bookmark
- Subscribe
- Mute
- Subscribe to RSS Feed
- Permalink
- Report Inappropriate Content
What version of Qlikview are you using?
- Mark as New
- Bookmark
- Subscribe
- Mute
- Subscribe to RSS Feed
- Permalink
- Report Inappropriate Content
v11
- Mark as New
- Bookmark
- Subscribe
- Mute
- Subscribe to RSS Feed
- Permalink
- Report Inappropriate Content
So will this help, in your case the Dimension will be Buyers
- Mark as New
- Bookmark
- Subscribe
- Mute
- Subscribe to RSS Feed
- Permalink
- Report Inappropriate Content
sorry - I dont think there are dimension limits in a pivot? I figured that writing a calculated dimension may work but I couldn't get the syntax correct...
- Mark as New
- Bookmark
- Subscribe
- Mute
- Subscribe to RSS Feed
- Permalink
- Report Inappropriate Content
Apologies
try this as an expression
IF(AGGR(RANK(SUM(Revenue)),Expense,Buyers) <= 5,SUM(Revenue))
- « Previous Replies
- Next Replies »