Unlock a world of possibilities! Login now and discover the exclusive benefits awaiting you.
- Qlik Community
- :
- All Forums
- :
- QlikView App Dev
- :
- complexe table
- Subscribe to RSS Feed
- Mark Topic as New
- Mark Topic as Read
- Float this Topic for Current User
- Bookmark
- Subscribe
- Mute
- Printer Friendly Page
- Mark as New
- Bookmark
- Subscribe
- Mute
- Subscribe to RSS Feed
- Permalink
- Report Inappropriate Content
complexe table
Hello,
i want to do this complex cross table :
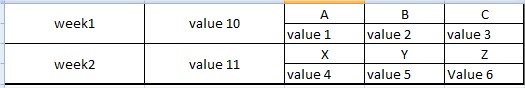
week and A, B, ... are dimensions.
How is possible ?
Thanks for your answers.
Sophie
- Mark as New
- Bookmark
- Subscribe
- Mute
- Subscribe to RSS Feed
- Permalink
- Report Inappropriate Content
Hi,
And what do you hope at result?
Because value 10 and value 11 can be the sum between the values 1-3 and 4-6, and you can build a cross table omiting the value 10 and value 11 and then calculate this.
Regards.
Enrique Mora.
- Mark as New
- Bookmark
- Subscribe
- Mute
- Subscribe to RSS Feed
- Permalink
- Report Inappropriate Content
hi Enrique,
no value 10 is not the sum of value 1-3 and 4-6.
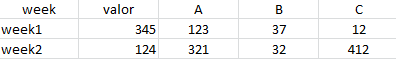
For the moment i can have this table :
But i want this solution in the same cross table :
Sophie
- Mark as New
- Bookmark
- Subscribe
- Mute
- Subscribe to RSS Feed
- Permalink
- Report Inappropriate Content
If you analyze your data, you will see that your data's look's like this:
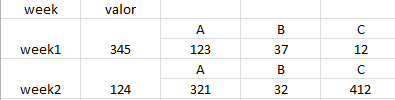
First, I will recommended you clean and structured your data to get a best comprehension of your data and have a best model to work.
To do this, you can build a table like this in excel with just a little change
Once you have this model you will charge the data like a normal file and you will get all correct.
In other hand, you can build a new excel sheet and load all the data from the first table and structured like you wanted.
I suggested you this because the most important for you model its structured the data, because you cann`t buil a cross table with this unstructured data model.
Regards.
Enrique Mora.
- Mark as New
- Bookmark
- Subscribe
- Mute
- Subscribe to RSS Feed
- Permalink
- Report Inappropriate Content
Hi,
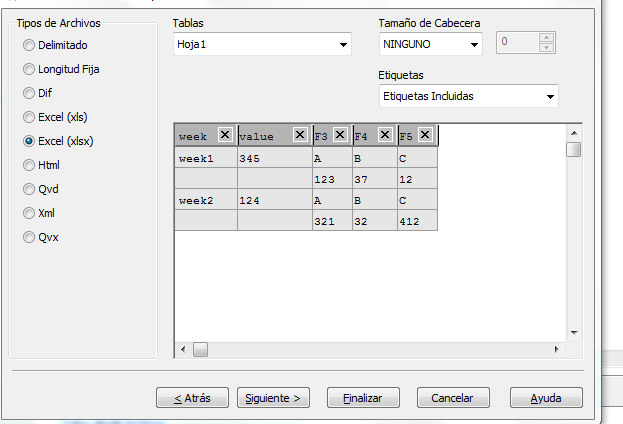
I'm trying to do your example with qlikView transformation, and I learn that you can do that:
First, charge the data with the Script Editor of your project, and charge with the assistant.
Then you will see that:
Once you have that, you must press next button, and in the next screen press to the centered button to hability the transformation of your data.
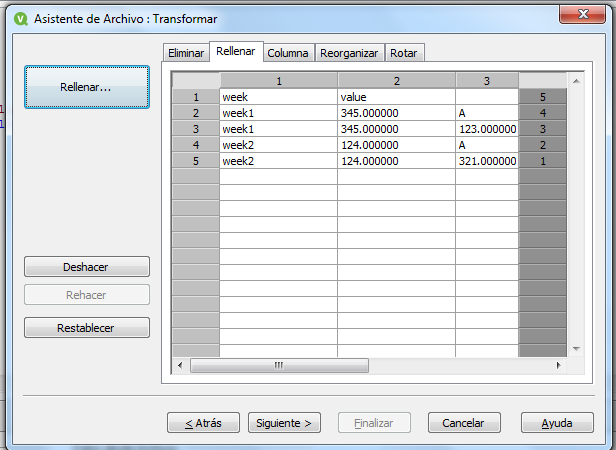
You will see something like this:
Now you must fill the data, you must go to the fill tab and here, select the fill button.
Select the option like this:
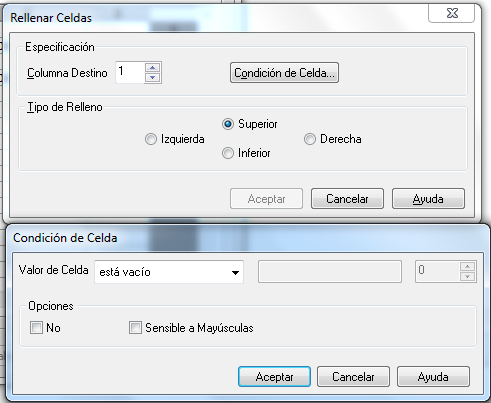
and press the 2 accept button.
Repeat the operation to the second column and finally you will get something like this:
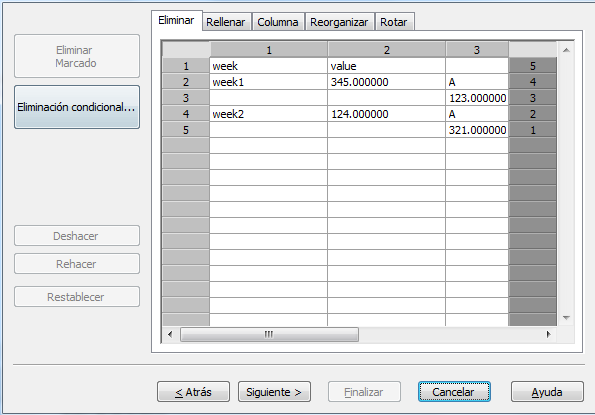
Once you have this, it's time to delete the lines that you don't wanted, so now go the drop sheet and press the Delete conditional button.
You must have something like this to delete the line with A, B....
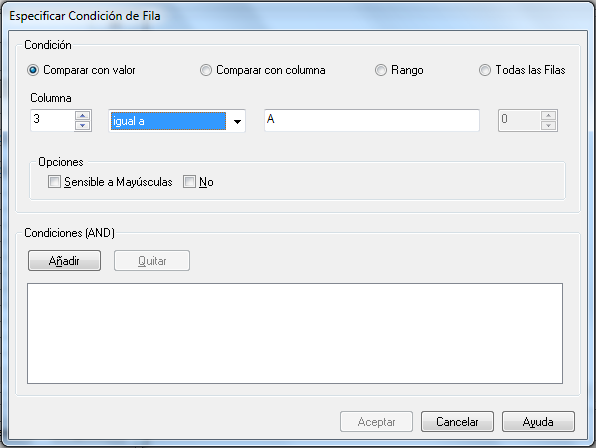
Then press to Add button and Accept.
And the final result must be something like this:
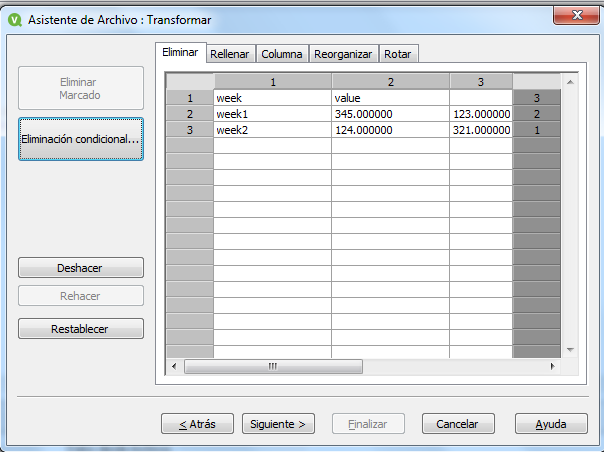
And finally you get the structured data that you wanted!!
Sorry for my traductions, you can see that I have spanish configuration to my QlikView tool.
Hope this help and be less tedious,
Regards.
Enrique Mora.