Unlock a world of possibilities! Login now and discover the exclusive benefits awaiting you.
- Qlik Community
- :
- All Forums
- :
- QlikView App Dev
- :
- count of workers under each manager rolling 6 mont...
- Subscribe to RSS Feed
- Mark Topic as New
- Mark Topic as Read
- Float this Topic for Current User
- Bookmark
- Subscribe
- Mute
- Printer Friendly Page
- Mark as New
- Bookmark
- Subscribe
- Mute
- Subscribe to RSS Feed
- Permalink
- Report Inappropriate Content
count of workers under each manager rolling 6 months
Hi Guru's
i need to calculate count of workers under each manager (Till Date)
.rolling 6 month count of workers where status='Open'
example:up to sep 15 51 workers under Manager Name 1
up to Oct 15 55 workers under Manager Name 2
etc
Please find the sample application.
Thanks
- Tags:
- new_to_qlikview
- Mark as New
- Bookmark
- Subscribe
- Mute
- Subscribe to RSS Feed
- Permalink
- Report Inappropriate Content
Try:
Create Month field in script
Month([HeadCount.Start Date]) as Month
Then in Chart use this new fields as dimension
Expression:
count({<HeadCount.Status={'Open'}, [Org Hierarchy.ITSLT Manager]={'Name1'} >}[No Of Workers])
count({<HeadCount.Status={'Open'}, [Org Hierarchy.ITSLT Manager]={'Name2'} >}[No Of Workers])
...
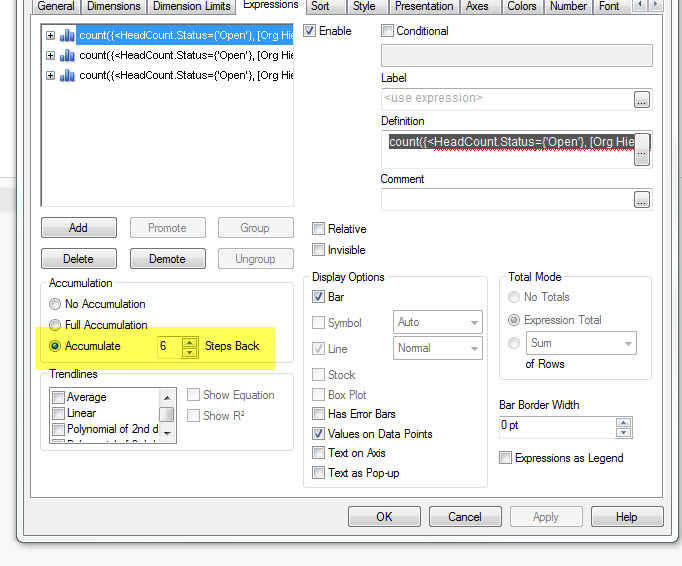
the use Accumulate option
- Mark as New
- Bookmark
- Subscribe
- Mute
- Subscribe to RSS Feed
- Permalink
- Report Inappropriate Content
Hi Thanks for Your Time
Yearmonth ,Manager are Two dimensions in Line chart
Count(workers) is the Expression
Output example:
Till Feb 2015 35 Workers Under Name1 Manager
Till march 2015 44 Workers under Name 1 manager
-
-
Till Jul 2015 46 Workers under Name 1 manager