Unlock a world of possibilities! Login now and discover the exclusive benefits awaiting you.
- Qlik Community
- :
- All Forums
- :
- QlikView App Dev
- :
- count
- Subscribe to RSS Feed
- Mark Topic as New
- Mark Topic as Read
- Float this Topic for Current User
- Bookmark
- Subscribe
- Mute
- Printer Friendly Page
- Mark as New
- Bookmark
- Subscribe
- Mute
- Subscribe to RSS Feed
- Permalink
- Report Inappropriate Content
count
Hi All,
Please find the attachment of the QVW file ,,,
Here i have a text object which shows count of test case id ..
And below is the detailed table .. sheet the count is
when i am selecting the Load date 5 may 2018 .. the counts of test iD in a text box is shwoing 538
and when i export the table into excel and the count of Test ID is 243 ...
I want to display the same count of Test case id in a text object too as that of excel ..how do i achieve this ..need help
Thanks in Advance
Accepted Solutions
- Mark as New
- Bookmark
- Subscribe
- Mute
- Subscribe to RSS Feed
- Permalink
- Report Inappropriate Content
Hi,
Count of data in excel is 243 one column is for column name so 242 records.
Use this in text object
=count(DISTINCT TEST_CASE_ID & TEST_CASE_NAME&
PRODUCT_NAME & RELEASE_ID & DUMP_TYPE & DUMP_ERROR)
you get 242 .
- Mark as New
- Bookmark
- Subscribe
- Mute
- Subscribe to RSS Feed
- Permalink
- Report Inappropriate Content
The reason you see the extra rows is because you have multiple rows for each combination of your dimension... Add Sum(1) as an expression and you will see this
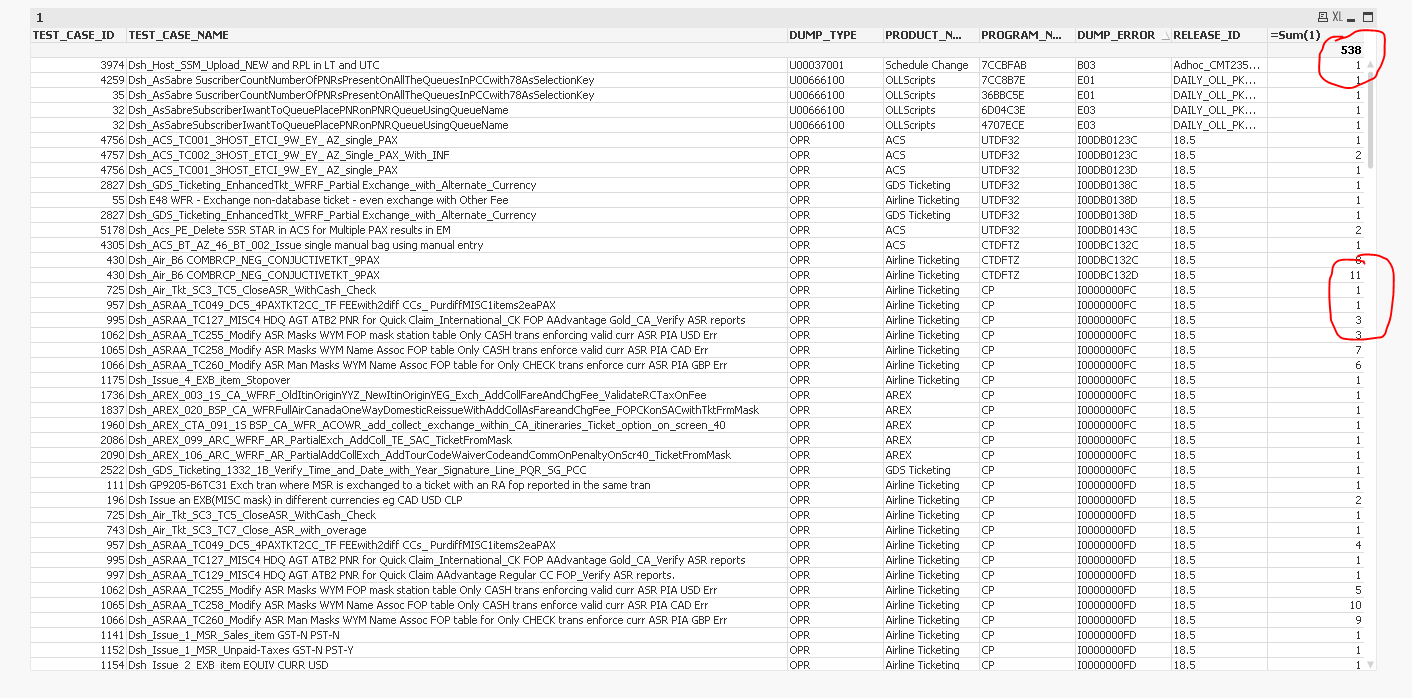
So, like keerthika mentioned, this should work
=Count(DISTINCT TEST_CASE_ID&TEST_CASE_NAME&DUMP_TYPE&PRODUCT_NAME&PROGRAM_NAME&DUMP_ERROR&RELEASE_ID)