Unlock a world of possibilities! Login now and discover the exclusive benefits awaiting you.
- Qlik Community
- :
- All Forums
- :
- QlikView App Dev
- :
- date in chart dimension x axis
- Subscribe to RSS Feed
- Mark Topic as New
- Mark Topic as Read
- Float this Topic for Current User
- Bookmark
- Subscribe
- Mute
- Printer Friendly Page
- Mark as New
- Bookmark
- Subscribe
- Mute
- Subscribe to RSS Feed
- Permalink
- Report Inappropriate Content
date in chart dimension x axis
Hello,
If i have this expression
=sum({<TimeTypeKey={1},DimDate2.NumericDateClean={'$(vRollingMonth)'}>} "[FactQVTimeRegistered].TimeRegistered")
I get data 6months back and 6 months forward.
The data is on day level, but it is 365 days. So if i show 365 on my x axis it will be pretty long - Is it possible to make an internval instead?
My data is organized so from eg. 1januar sales grows until 31 januar, and then on the 1 feburar it starts all over.
Is it possible to show this on day level with internval? so i dont have to show 365 days? - I dont wont to show month because then i will only get the total for this.
I want to show it on day level without x asix being on day level..
Hope you know what i mean
- Mark as New
- Bookmark
- Subscribe
- Mute
- Subscribe to RSS Feed
- Permalink
- Report Inappropriate Content
my variables look like this:
LET vNext6Months =num(AddMonths(vDateToday,+6))
LET vPast6Months =num(Monthstart(AddMonths(vDateToday,-6)))
LET vRollingMonth ='>=$(vPast6Months) <=$(vNext6Months)'
- Mark as New
- Bookmark
- Subscribe
- Mute
- Subscribe to RSS Feed
- Permalink
- Report Inappropriate Content
HI,
You can create a group which can be drilled down from year to qtr to month to week to date.
In dimension tab you will find the option at left bottom named "Edit Group".
Regards,
Kaushik Solanki
- Mark as New
- Bookmark
- Subscribe
- Mute
- Subscribe to RSS Feed
- Permalink
- Report Inappropriate Content
Actually i just tried that before you wrote  This works like i want, but the business does not agree hehe
The business just had another demand to me.They want to show the end month result on all days instead. So the total for the month is spread on all days. Is this possible`?
- Mark as New
- Bookmark
- Subscribe
- Mute
- Subscribe to RSS Feed
- Permalink
- Report Inappropriate Content
HI,
Can you give one example of what exactly your business needs.
Rergards,
Kaushik Solanki
- Mark as New
- Bookmark
- Subscribe
- Mute
- Subscribe to RSS Feed
- Permalink
- Report Inappropriate Content
Just attached a picture - hope it makes sense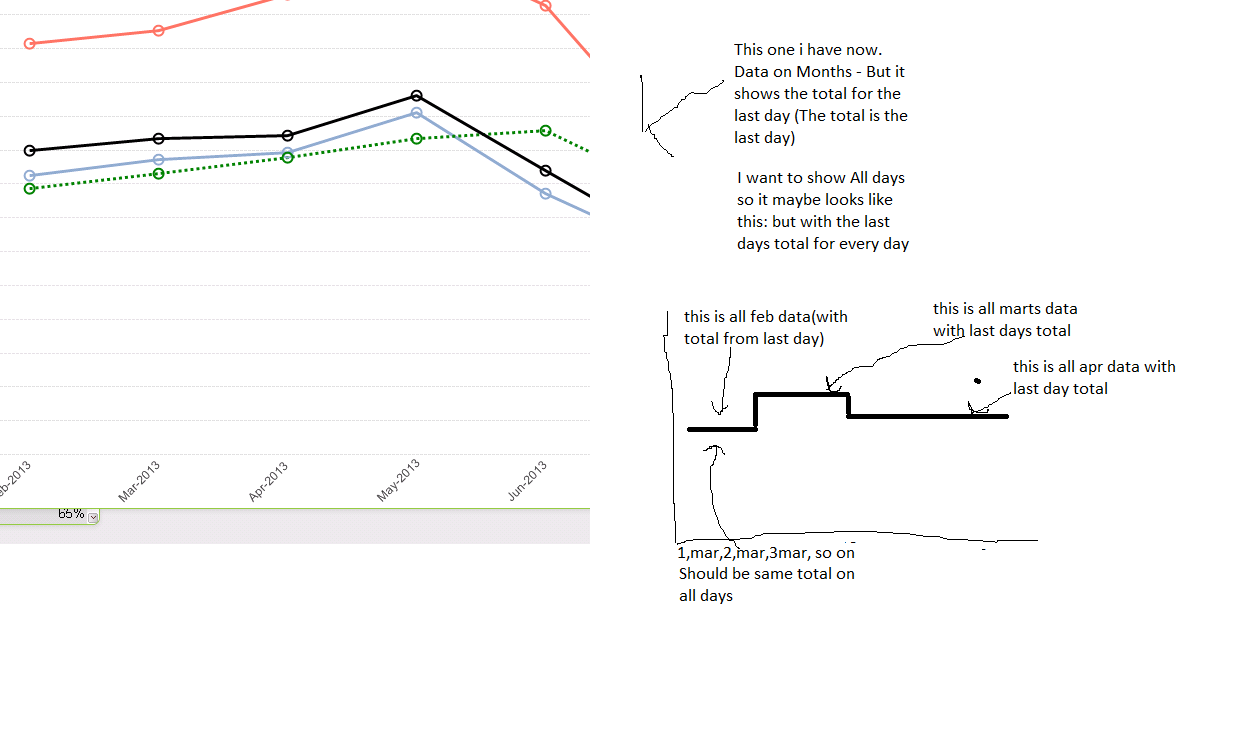
- Mark as New
- Bookmark
- Subscribe
- Mute
- Subscribe to RSS Feed
- Permalink
- Report Inappropriate Content
Hi,
Do you mean to show the total of full month for each and every day?
Regards,
Kaushik Solanki
- Mark as New
- Bookmark
- Subscribe
- Mute
- Subscribe to RSS Feed
- Permalink
- Report Inappropriate Content
Sorry yes- The total for one month on all days 
- Mark as New
- Bookmark
- Subscribe
- Mute
- Subscribe to RSS Feed
- Permalink
- Report Inappropriate Content
any idea?