Unlock a world of possibilities! Login now and discover the exclusive benefits awaiting you.
- Qlik Community
- :
- All Forums
- :
- QlikView App Dev
- :
- difference between bar and stack chart?
- Subscribe to RSS Feed
- Mark Topic as New
- Mark Topic as Read
- Float this Topic for Current User
- Bookmark
- Subscribe
- Mute
- Printer Friendly Page
- Mark as New
- Bookmark
- Subscribe
- Mute
- Subscribe to RSS Feed
- Permalink
- Report Inappropriate Content
difference between bar and stack chart?
difference between bar and stack chart?
- Tags:
- new_to_qlikview
- Mark as New
- Bookmark
- Subscribe
- Mute
- Subscribe to RSS Feed
- Permalink
- Report Inappropriate Content
Qlikview doesn't know a stack bar. There are bar charts and those can have two styles: grouped or stacked.
talk is cheap, supply exceeds demand
- Mark as New
- Bookmark
- Subscribe
- Mute
- Subscribe to RSS Feed
- Permalink
- Report Inappropriate Content
Example:
Say you have a chart that shows revenue per month:
Grouped Bar Chart = 12 bars, one per month.
Stacked Bar Chart = One bar for a cumulative figure.
- Mark as New
- Bookmark
- Subscribe
- Mute
- Subscribe to RSS Feed
- Permalink
- Report Inappropriate Content
then difference between block and bar chart?
- Mark as New
- Bookmark
- Subscribe
- Mute
- Subscribe to RSS Feed
- Permalink
- Report Inappropriate Content
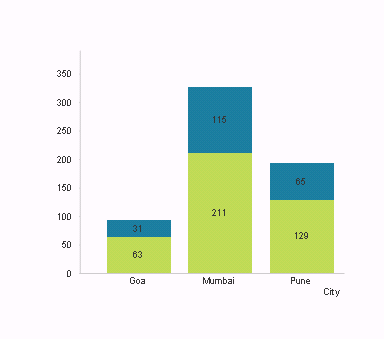
Hi Manoj,
If U specify 2 or more expressions against a dimension in a bar chart, then u can display it using a stacked bar chart. Example: If ur dimension is City and u specify 2 expressions as 'Target turnover' and 'Actual turn over' then u can represent it using a stacked bar chart as shown in following fig.
- Mark as New
- Bookmark
- Subscribe
- Mute
- Subscribe to RSS Feed
- Permalink
- Report Inappropriate Content
A block chart will show grouped proportunate values.
- Mark as New
- Bookmark
- Subscribe
- Mute
- Subscribe to RSS Feed
- Permalink
- Report Inappropriate Content
Checkout the Data Visualization QlikView demo application, it highlights different charts and gives general guidance on when to use them.