Unlock a world of possibilities! Login now and discover the exclusive benefits awaiting you.
- Qlik Community
- :
- All Forums
- :
- QlikView App Dev
- :
- dimension label for class
- Subscribe to RSS Feed
- Mark Topic as New
- Mark Topic as Read
- Float this Topic for Current User
- Bookmark
- Subscribe
- Mute
- Printer Friendly Page
- Mark as New
- Bookmark
- Subscribe
- Mute
- Subscribe to RSS Feed
- Permalink
- Report Inappropriate Content
dimension label for class
Hi,
In attached qvw file contains a barchart.
In dimesion tab:
Class(AngleTabPos,10)
In expression tab:
Count(Lenskey)
Note :User has a chance to view only 10 values(bars) at a time.
Now what i am trying to work is in dimension labels are displaying as "0<=x<10, 10<=x<20, 20<=x<30..................350<=x<360", but what i want to display is "10,20,30,...............360".
Is it possible to do this ?
Thanks in advance.
- Mark as New
- Bookmark
- Subscribe
- Mute
- Subscribe to RSS Feed
- Permalink
- Report Inappropriate Content
Hi,
No its not getting what we expected. It is showing like "3739, 3939, 4339..." instead of "100,200,300,...".
I done same what you mentioned in post , but not able to get it.
Any other way to get it.
Thanks
- Mark as New
- Bookmark
- Subscribe
- Mute
- Subscribe to RSS Feed
- Permalink
- Report Inappropriate Content
Hi
Can you check and tel me whats min(Lenskey) there?
- Mark as New
- Bookmark
- Subscribe
- Mute
- Subscribe to RSS Feed
- Permalink
- Report Inappropriate Content
Hi,
Can you attach a image as chart with vRange(Num(Class(LensKey,100)) - vRange) variable and without vRange(Num(Class(LensKey,100)) ) variable , vRange value and Min(LensKey) value in text object.
Celambarasan
- Mark as New
- Bookmark
- Subscribe
- Mute
- Subscribe to RSS Feed
- Permalink
- Report Inappropriate Content
Hi,
Min of Lenskey =1879586761
Thanks
- Mark as New
- Bookmark
- Subscribe
- Mute
- Subscribe to RSS Feed
- Permalink
- Report Inappropriate Content
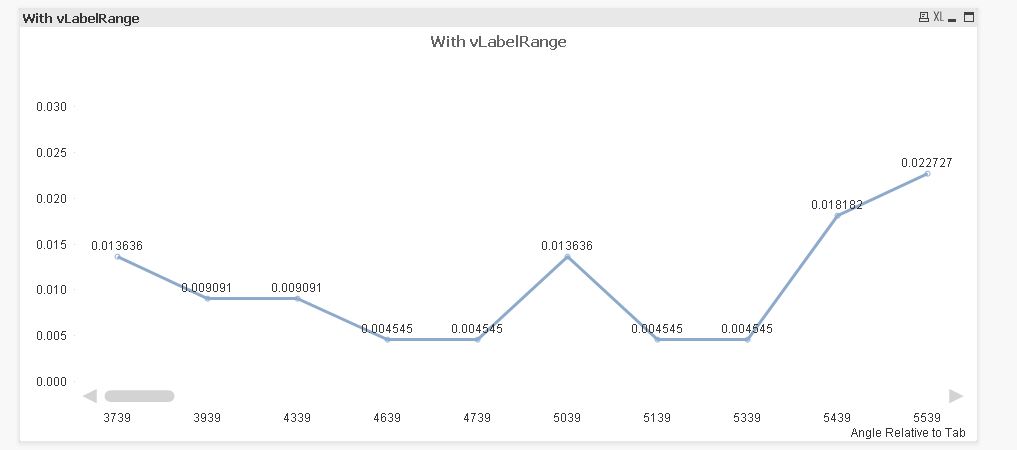
Hi,
Please find the attached images of "WithvRange" , "WithOutvRange", "vRange", "Min(Lenskey)" values.
Thanks
.JPG)
- Mark as New
- Bookmark
- Subscribe
- Mute
- Subscribe to RSS Feed
- Permalink
- Report Inappropriate Content
Hi,
Check with this
vRange with value "=((floor(Min({1}Lenskey)/100)*100)-100)"
Use dimension expression like this Num(Class(LensKey,100)) - vRange
Hope it helps
Celambarasan
- Mark as New
- Bookmark
- Subscribe
- Mute
- Subscribe to RSS Feed
- Permalink
- Report Inappropriate Content
Hi,
No, it is displaying like 3800, 4000, 4400, 4700...........
Thanks
- Mark as New
- Bookmark
- Subscribe
- Mute
- Subscribe to RSS Feed
- Permalink
- Report Inappropriate Content
Hi,
Have you done any selection or ignored selection in your expression?
- Mark as New
- Bookmark
- Subscribe
- Mute
- Subscribe to RSS Feed
- Permalink
- Report Inappropriate Content
Hi,
i used single expression as seen below :
=Count({$<DefectName={"Defect.EdgeChip"}>} LensKey)/Count({$<DefectName={"Defect.EdgeChip"}>} TOTAL LensKey)
Thanks
- Mark as New
- Bookmark
- Subscribe
- Mute
- Subscribe to RSS Feed
- Permalink
- Report Inappropriate Content
Hi,
Then add that set analysis expr to the min
vRange with value "=((floor(Min({$<DefectName={'Defect.EdgeChip'}>} Lenskey)/100)*100)-100)"
Use dimension expression like this Num(Class(LensKey,100)) - vRange
Hope it helps
Celambarasa