Unlock a world of possibilities! Login now and discover the exclusive benefits awaiting you.
- Qlik Community
- :
- All Forums
- :
- QlikView App Dev
- :
- discard outliers in the scatter chart
- Subscribe to RSS Feed
- Mark Topic as New
- Mark Topic as Read
- Float this Topic for Current User
- Bookmark
- Subscribe
- Mute
- Printer Friendly Page
- Mark as New
- Bookmark
- Subscribe
- Mute
- Subscribe to RSS Feed
- Permalink
- Report Inappropriate Content
discard outliers in the scatter chart
hi,
i would like to discard or ignore the outliers in the scatter chart. can anyone help me? attached the example
- Mark as New
- Bookmark
- Subscribe
- Mute
- Subscribe to RSS Feed
- Permalink
- Report Inappropriate Content
any help?
- Mark as New
- Bookmark
- Subscribe
- Mute
- Subscribe to RSS Feed
- Permalink
- Report Inappropriate Content
Hi,
Do you want like this?
- Mark as New
- Bookmark
- Subscribe
- Mute
- Subscribe to RSS Feed
- Permalink
- Report Inappropriate Content
I dont see any difference between my file and your image.
I want to exclude the values which are unusually large on both axis..
- Mark as New
- Bookmark
- Subscribe
- Mute
- Subscribe to RSS Feed
- Permalink
- Report Inappropriate Content
May be like in attached sample.
- Mark as New
- Bookmark
- Subscribe
- Mute
- Subscribe to RSS Feed
- Permalink
- Report Inappropriate Content
Hi Tresesco,
This is a sample, so we could easily figure out what we dont want and filter it out.
But actual dataset with many countries and many years of revenue and profit, we cant hardcode the number,
Is there anyway to remove the outliers based on the current selected value dynamically using function like fractile or standard deviation???
- Mark as New
- Bookmark
- Subscribe
- Mute
- Subscribe to RSS Feed
- Permalink
- Report Inappropriate Content
bump
- Mark as New
- Bookmark
- Subscribe
- Mute
- Subscribe to RSS Feed
- Permalink
- Report Inappropriate Content
You have to have a rule to decide which values to be discarded, say for example if you wish to discard the top two values, you may try expression like:
Sum ({<[Customer Name]={"=Rank(Sum (Sales))>2"}>}Sales)
Update: Using fractile()
Sum ({<[Customer Name]={"=Sum(Sales)<Fractile(total Sales, 0.99)"}>}Sales)
- Mark as New
- Bookmark
- Subscribe
- Mute
- Subscribe to RSS Feed
- Permalink
- Report Inappropriate Content
Often you will find outliers by using the Fractile() function. For example, include only the best 90%, use something like:
=If(Sum(Value) > Fractile(Sum(Value), 0.05) And Sum(Value) < Fractile(Sum(Value), 0.95), Sum(Value))
- Mark as New
- Bookmark
- Subscribe
- Mute
- Subscribe to RSS Feed
- Permalink
- Report Inappropriate Content
Hi Gautham Prasad,
What do you define outliers?
I've filter out the outliers based on following formula:
As per Inter quartile range (IQR), outliers are those whose value is
1. value > Q3 + 1.5*IQR
2. value < Q1 - 1.5*IQR
See below pic.
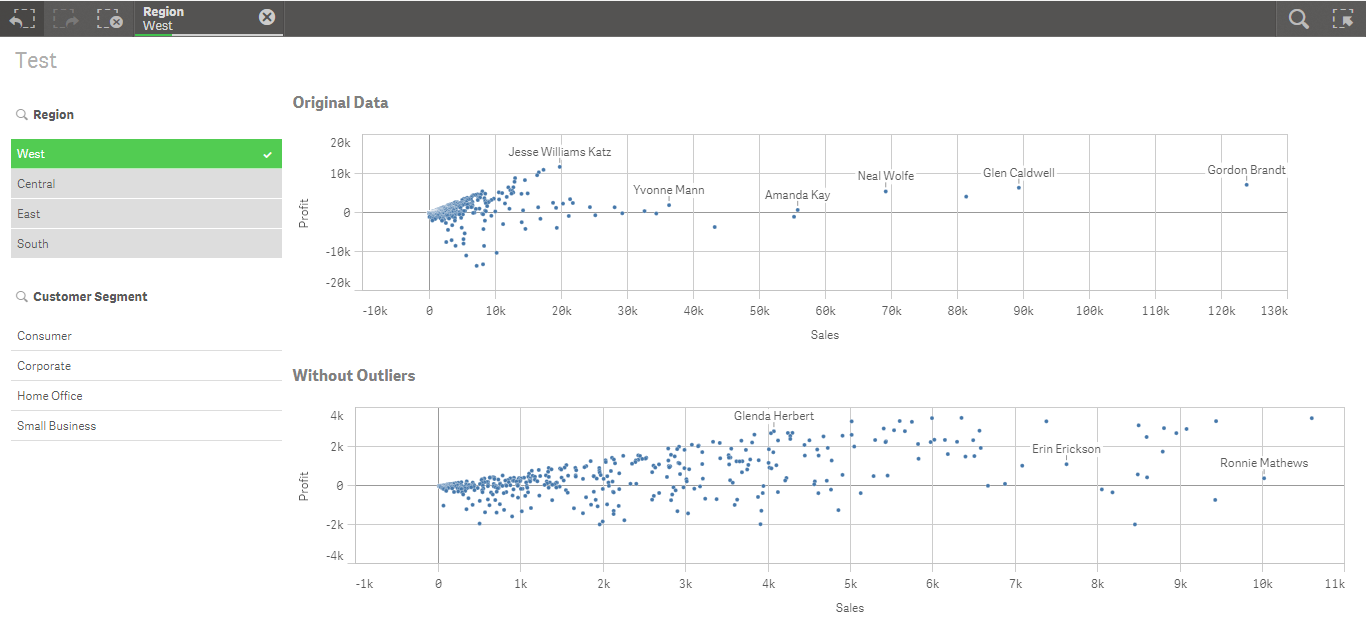
I've done this in qlik sense. PFA .qvf file.