Unlock a world of possibilities! Login now and discover the exclusive benefits awaiting you.
- Qlik Community
- :
- All Forums
- :
- QlikView App Dev
- :
- Re: display only the highest value with respect to...
- Subscribe to RSS Feed
- Mark Topic as New
- Mark Topic as Read
- Float this Topic for Current User
- Bookmark
- Subscribe
- Mute
- Printer Friendly Page
- Mark as New
- Bookmark
- Subscribe
- Mute
- Subscribe to RSS Feed
- Permalink
- Report Inappropriate Content
display only the highest value with respect to the dimension
Hi All,
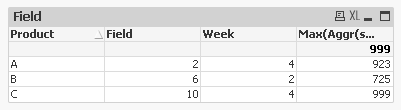
I am trying to create a table and a bar chart where the highest value of sum(value) with respect to each Product is only displayed in the table and a bar chart. Can someone help me in displaying only these top values against the product in a table and a bar chart?
In the table I would like to have Product, Field, Week and the expression sum(value) [only the top values].
In the bar chart I am looking for sum(value) against the Product dimension [only the top values].
PFA a sample QVW.

Accepted Solutions
- Mark as New
- Bookmark
- Subscribe
- Mute
- Subscribe to RSS Feed
- Permalink
- Report Inappropriate Content
- Mark as New
- Bookmark
- Subscribe
- Mute
- Subscribe to RSS Feed
- Permalink
- Report Inappropriate Content
PFA
- Mark as New
- Bookmark
- Subscribe
- Mute
- Subscribe to RSS Feed
- Permalink
- Report Inappropriate Content
Hi Tresesco,
Thank you for the response.
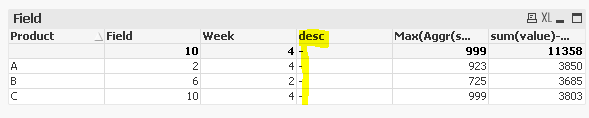
This looks good, However I have a concern.
In case I had another field "desc" and if I would like to have this field too in the table, as shown in pic2, how can I achieve this?

- Mark as New
- Bookmark
- Subscribe
- Mute
- Subscribe to RSS Feed
- Permalink
- Report Inappropriate Content
Tresesco,
PFA the updated qvw. !
- Mark as New
- Bookmark
- Subscribe
- Mute
- Subscribe to RSS Feed
- Permalink
- Report Inappropriate Content
Have a look at the expression using firstsortedvalue() given for other fields. You have to just adjust the field name and parameter in aggr().
If your desc field has one-to-one mapping with already mentioned field, you could just try like:
FirstSortedValue(desc,-Aggr(sum(value),Product,Week,Field))
Else, you might have to include the new field in aggr as well, like
FirstSortedValue(desc,-Aggr(sum(value),Product,Week,Field,desc))
Note: the positioning of desc/new field in aggr() would depend on the granularity per se.
Try to grab the concept instead of just finding for instant solution. Later on, you would be able to solve the issue yourself.
- Mark as New
- Bookmark
- Subscribe
- Mute
- Subscribe to RSS Feed
- Permalink
- Report Inappropriate Content
FirstSortedValue(desc,-Aggr(sum(value),Product,Week,Field))
- Mark as New
- Bookmark
- Subscribe
- Mute
- Subscribe to RSS Feed
- Permalink
- Report Inappropriate Content
Hi Tresesco,
You are right, this works. I have never got a chance to use FirstSortedValue() before. Now I've understood how it works.
Thank you.
- Mark as New
- Bookmark
- Subscribe
- Mute
- Subscribe to RSS Feed
- Permalink
- Report Inappropriate Content
Are you able to post the f(n), please? Security settings on my work laptop are preventing me from using the qvw file.
Thanks!