Unlock a world of possibilities! Login now and discover the exclusive benefits awaiting you.
- Qlik Community
- :
- All Forums
- :
- QlikView App Dev
- :
- display total and detail numbers in a graph
- Subscribe to RSS Feed
- Mark Topic as New
- Mark Topic as Read
- Float this Topic for Current User
- Bookmark
- Subscribe
- Mute
- Printer Friendly Page
- Mark as New
- Bookmark
- Subscribe
- Mute
- Subscribe to RSS Feed
- Permalink
- Report Inappropriate Content
display total and detail numbers in a graph
Hi Qlik guru's
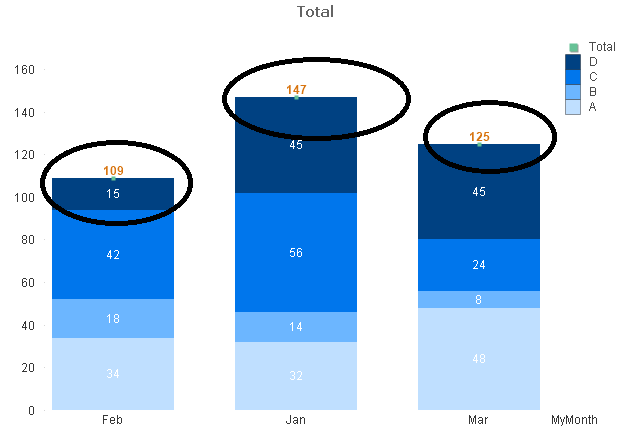
I need to display, In a stacked bar charts the detail values and the Total Values.
Like a combination of both graphs attached.
I don't mind if the total numbers are on the top or close to the axis.
Any idea?
Cheers,
Eva
- Tags:
- new_to_qlikview
- « Previous Replies
-
- 1
- 2
- Next Replies »
Accepted Solutions
- Mark as New
- Bookmark
- Subscribe
- Mute
- Subscribe to RSS Feed
- Permalink
- Report Inappropriate Content
- Mark as New
- Bookmark
- Subscribe
- Mute
- Subscribe to RSS Feed
- Permalink
- Report Inappropriate Content
See the Attachment.
Regards
Av7eN
- Mark as New
- Bookmark
- Subscribe
- Mute
- Subscribe to RSS Feed
- Permalink
- Report Inappropriate Content
Hi Eva,
Please see my idea in attached file.
Regards,
Sokkorn
- Mark as New
- Bookmark
- Subscribe
- Mute
- Subscribe to RSS Feed
- Permalink
- Report Inappropriate Content
Unfortunately, I don't know how many Dim values I will get.
:S
I updated my file with expected result.
- Mark as New
- Bookmark
- Subscribe
- Mute
- Subscribe to RSS Feed
- Permalink
- Report Inappropriate Content
Sokkorn, You are my master!!1 You rocks.
Thanks a lot
- Mark as New
- Bookmark
- Subscribe
- Mute
- Subscribe to RSS Feed
- Permalink
- Report Inappropriate Content
Hi Eva
There is one more alternative.
Following is the Snapshot:
See the Attachment.
Regards
Av7eN
- Mark as New
- Bookmark
- Subscribe
- Mute
- Subscribe to RSS Feed
- Permalink
- Report Inappropriate Content
Dear master Sokkorn,
A last question,
In the real data set I get an alignment bizarre.
Do you know how I can align everything?
Eva
- Mark as New
- Bookmark
- Subscribe
- Mute
- Subscribe to RSS Feed
- Permalink
- Report Inappropriate Content
Hi Eva,
You may try by:
1. Click on bar chart object
2. Hold down Ctrl+Shift
3. Move red line base on your desire.
Just call my name is enough  . No need master.
Regards,
Sokkorn
- Mark as New
- Bookmark
- Subscribe
- Mute
- Subscribe to RSS Feed
- Permalink
- Report Inappropriate Content
I just found a solution for the alignment problem.
Add a nodistinct in the formula and the text in white if the RowNo() >1
So far I didn't get why that append 
Thanks a lot for you help.
Cheers,
- Mark as New
- Bookmark
- Subscribe
- Mute
- Subscribe to RSS Feed
- Permalink
- Report Inappropriate Content
Hi Eva,
Nice!!! and thanks for share solution.
Regards,
Sokkorn
- « Previous Replies
-
- 1
- 2
- Next Replies »