Unlock a world of possibilities! Login now and discover the exclusive benefits awaiting you.
- Qlik Community
- :
- All Forums
- :
- QlikView App Dev
- :
- display total and detail numbers in a graph
Options
- Subscribe to RSS Feed
- Mark Topic as New
- Mark Topic as Read
- Float this Topic for Current User
- Bookmark
- Subscribe
- Mute
- Printer Friendly Page
Turn on suggestions
Auto-suggest helps you quickly narrow down your search results by suggesting possible matches as you type.
Showing results for
Not applicable
2014-10-20
12:15 AM
- Mark as New
- Bookmark
- Subscribe
- Mute
- Subscribe to RSS Feed
- Permalink
- Report Inappropriate Content
display total and detail numbers in a graph
Hi Qlik guru's
I need to display, In a stacked bar charts the detail values and the Total Values.
Like a combination of both graphs attached.
I don't mind if the total numbers are on the top or close to the axis.
Any idea?
Cheers,
Eva
- Tags:
- new_to_qlikview
2,203 Views
- « Previous Replies
-
- 1
- 2
- Next Replies »
11 Replies
Not applicable
2014-10-21
08:59 PM
Author
- Mark as New
- Bookmark
- Subscribe
- Mute
- Subscribe to RSS Feed
- Permalink
- Report Inappropriate Content
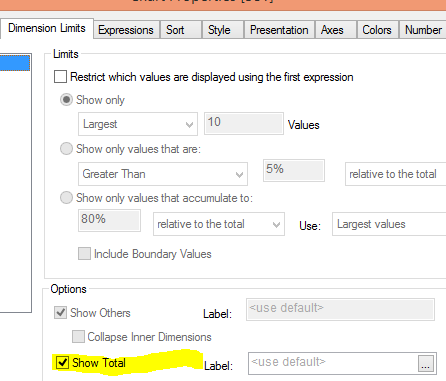
On the Dimension Limits, there is an Option Show Total check box. It will add a new bar to the chart..
271 Views
Not applicable
2014-10-21
09:08 PM
Author
- Mark as New
- Bookmark
- Subscribe
- Mute
- Subscribe to RSS Feed
- Permalink
- Report Inappropriate Content
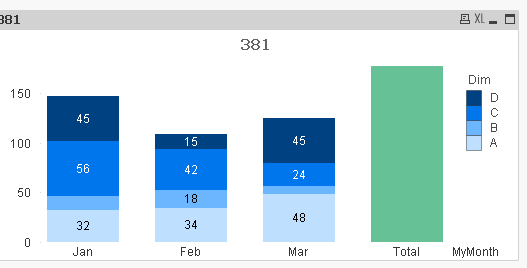
It doesn't works, the purpose is showing the total per month, not the Grand Total.
271 Views
- « Previous Replies
-
- 1
- 2
- Next Replies »