Unlock a world of possibilities! Login now and discover the exclusive benefits awaiting you.
- Qlik Community
- :
- All Forums
- :
- QlikView App Dev
- :
- help needed with set analysis in line chart
- Subscribe to RSS Feed
- Mark Topic as New
- Mark Topic as Read
- Float this Topic for Current User
- Bookmark
- Subscribe
- Mute
- Printer Friendly Page
- Mark as New
- Bookmark
- Subscribe
- Mute
- Subscribe to RSS Feed
- Permalink
- Report Inappropriate Content
help needed with set analysis in line chart
Hi,
I am trying to implement a set analysis expression in a line chart which is same as the expression in my gauge chart
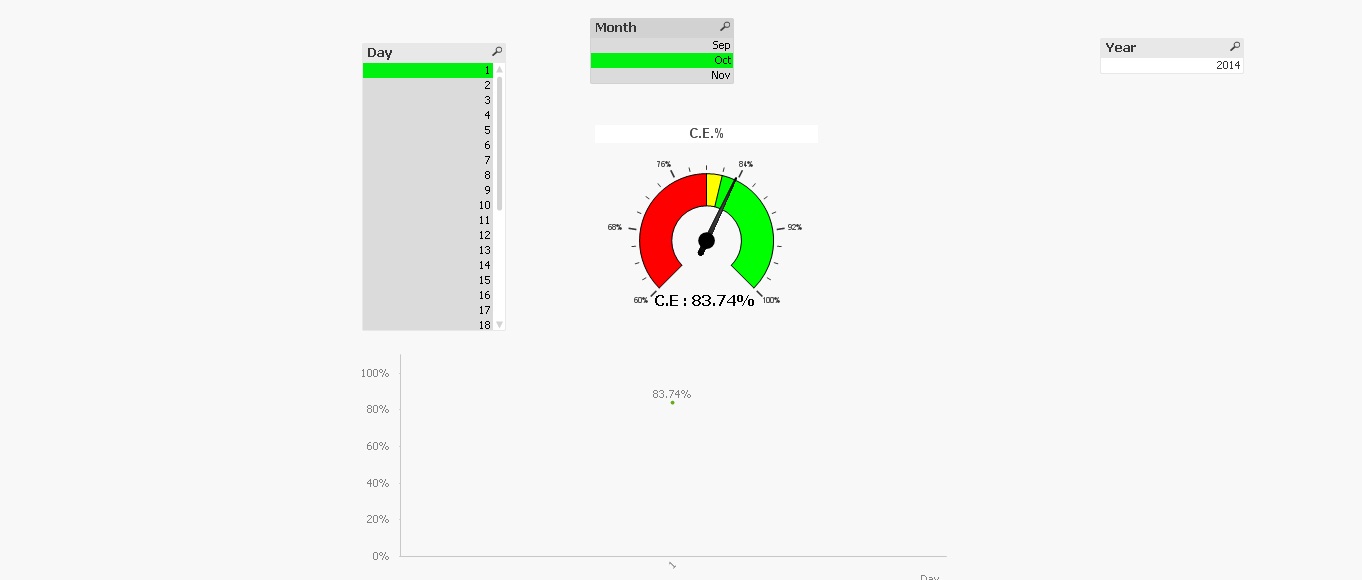
The problem is that I want the dimensions to be day but i am unable to get the proper values in the line chart .
The expression works with the gauge chart .!!!
For eg if the gauge chart shows C.E. for a particular day is 80% the same should be shown by the line chart including all other days .
the dimension should be restricted to day only .
What could be done in order to get this working .
I am also attaching my QVW app for reference.
Accepted Solutions
- Mark as New
- Bookmark
- Subscribe
- Mute
- Subscribe to RSS Feed
- Permalink
- Report Inappropriate Content
HI,
I used this
=sum({<[MARA.Material Type_MTART]={'HALB'}>}[VEKP.Loading volume_NTVOL])/[Glass Melt]
as the no of days are already present as dimension in the chart we dont need to multiply the glass melt with the no of days !
- Mark as New
- Bookmark
- Subscribe
- Mute
- Subscribe to RSS Feed
- Permalink
- Report Inappropriate Content
Hi Nadeem,
Try this expression in your line chart:
=(sum({<[MARA.Material Type_MTART]={'HALB'}>}[VEKP.Loading volume_NTVOL])/(sum([Glass Melt]*$(vnoofdaysincrement))))
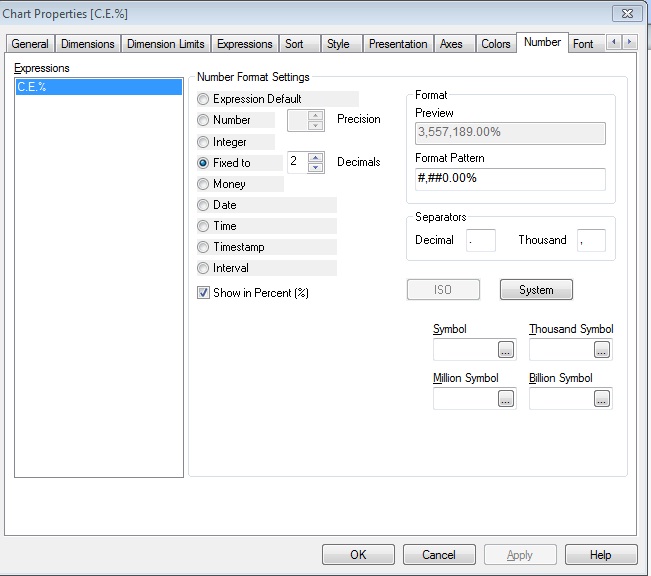
And set number format for the same is as below:

Let me know is this is what you are looking for.
Regards,
Vidit Desai
- Mark as New
- Bookmark
- Subscribe
- Mute
- Subscribe to RSS Feed
- Permalink
- Report Inappropriate Content
Hi,
Thanks for taking your time to reply
it does not work can u send me a screenshot if you implemented in the sample app
Regards,
Nadeem
- Mark as New
- Bookmark
- Subscribe
- Mute
- Subscribe to RSS Feed
- Permalink
- Report Inappropriate Content
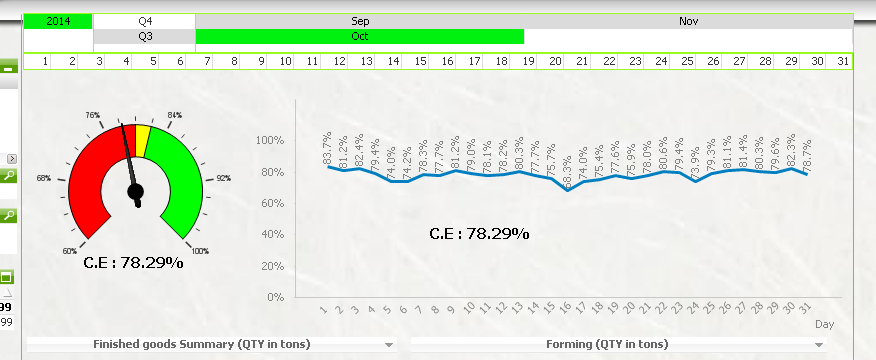
Is this what you want?

- Mark as New
- Bookmark
- Subscribe
- Mute
- Subscribe to RSS Feed
- Permalink
- Report Inappropriate Content
I think it might be not possible.. what you are looking for..
- Mark as New
- Bookmark
- Subscribe
- Mute
- Subscribe to RSS Feed
- Permalink
- Report Inappropriate Content
Nope the CE should come day wise if i select a particular month
- Mark as New
- Bookmark
- Subscribe
- Mute
- Subscribe to RSS Feed
- Permalink
- Report Inappropriate Content
can i implement the CE formula in the backend
- Mark as New
- Bookmark
- Subscribe
- Mute
- Subscribe to RSS Feed
- Permalink
- Report Inappropriate Content
HI,
I used this
=sum({<[MARA.Material Type_MTART]={'HALB'}>}[VEKP.Loading volume_NTVOL])/[Glass Melt]
as the no of days are already present as dimension in the chart we dont need to multiply the glass melt with the no of days !
- Mark as New
- Bookmark
- Subscribe
- Mute
- Subscribe to RSS Feed
- Permalink
- Report Inappropriate Content
Hi,
Please try below formula in your expression:
=(sum({$<Day=>}if([MARA.Material Type_MTART]='HALB',[VEKP.Loading volume_NTVOL]))/
(avg({<year=,month=>}[Glass Melt])))

You will get above chart for the month of Oct, i think this would achieve your requirement.