Unlock a world of possibilities! Login now and discover the exclusive benefits awaiting you.
- Qlik Community
- :
- All Forums
- :
- QlikView App Dev
- :
- help required in chart expression
- Subscribe to RSS Feed
- Mark Topic as New
- Mark Topic as Read
- Float this Topic for Current User
- Bookmark
- Subscribe
- Mute
- Printer Friendly Page
- Mark as New
- Bookmark
- Subscribe
- Mute
- Subscribe to RSS Feed
- Permalink
- Report Inappropriate Content
help required in chart expression
Hi Team,
I have few fields like below:
[Project Name] [UT1] [UT2] [UT3] [UT4]
XXX Y N [NULL] [NULL]
YYY N [NULL] [NULL] [NULL]
[UT] fields will can only have 3 values: Y, N, [NULL]
Now, I need to create a consolidated report based on below logic:
- If percentage of Yes out of the UTs available (ignoring [NULL] entries) is equal to 100% then Green
- If percentage of Yes out of the UTs available (ignoring [NULL] entries) is greater than 40% but less than 100% then Amber
- If percentage of Yes out of the UTs available (ignoring [NULL] entries) is less than 40% then Red
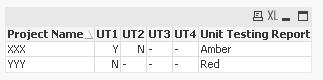
Project Name | Unit Testing Report |
XXX | Amber |
YYY | Red |
XXX is Amber since 1 Y out of 2 entries available (ignoring Null). So 50%
YYY is Red since 0 Y out of 1 entries available (ignoring Null). So 0%
Can you please help me in creating this above straight chart.
Thanks
- Tags:
- new_to_qlikview
Accepted Solutions
- Mark as New
- Bookmark
- Subscribe
- Mute
- Subscribe to RSS Feed
- Permalink
- Report Inappropriate Content
- Mark as New
- Bookmark
- Subscribe
- Mute
- Subscribe to RSS Feed
- Permalink
- Report Inappropriate Content
Hi :
Here you have a esplendid introduction into the NULL world, made by HIC NULL handling in QlikView
Hope this helps,
Joaquín
- Mark as New
- Bookmark
- Subscribe
- Mute
- Subscribe to RSS Feed
- Permalink
- Report Inappropriate Content
Try this:
Table:
LOAD *,
If(RangeAvg(UT1, UT2, UT3, UT4) = 1, 'Green', If(RangeAvg(UT1, UT2, UT3, UT4) >= 0.40, 'Amber', 'Red')) as [Unit Testing Report];
Load [Project Name],
Dual(UT1, If(UT1 = 'Y', 1, If(UT1 = 'N', 0))) as UT1,
Dual(UT2, If(UT2 = 'Y', 1, If(UT2 = 'N', 0))) as UT2,
Dual(UT3, If(UT3 = 'Y', 1, If(UT3 = 'N', 0))) as UT3,
Dual(UT4, If(UT4 = 'Y', 1, If(UT4 = 'N', 0))) as UT4;
LOAD * INLINE [
Project Name, UT1, UT2, UT3, UT4
XXX, Y, N
YYY, N
];
Output:
- Mark as New
- Bookmark
- Subscribe
- Mute
- Subscribe to RSS Feed
- Permalink
- Report Inappropriate Content
Hi sunindia,
Can we please have this in chart exp and not while loading.
- Mark as New
- Bookmark
- Subscribe
- Mute
- Subscribe to RSS Feed
- Permalink
- Report Inappropriate Content
Hi,
see attachment.
Regards,
Antonio
- Mark as New
- Bookmark
- Subscribe
- Mute
- Subscribe to RSS Feed
- Permalink
- Report Inappropriate Content
Try this expression with Project Name as dimension
=If(RangeAvg(If(UT1 = 'Y', 1, If(UT1 = 'N', 0)),
If(UT2 = 'Y', 1, If(UT2 = 'N', 0)),
If(UT3 = 'Y', 1, If(UT3 = 'N', 0)),
If(UT4 = 'Y', 1, If(UT4 = 'N', 0))) = 1, 'Green',
If(RangeAvg(If(UT1 = 'Y', 1, If(UT1 = 'N', 0)),
If(UT2 = 'Y', 1, If(UT2 = 'N', 0)),
If(UT3 = 'Y', 1, If(UT3 = 'N', 0)),
If(UT4 = 'Y', 1, If(UT4 = 'N', 0))) >= 0.40, 'Amber', 'Red'))