Unlock a world of possibilities! Login now and discover the exclusive benefits awaiting you.
- Qlik Community
- :
- All Forums
- :
- QlikView App Dev
- :
- Re: help with expression - aggregation DIFFERENT ...
- Subscribe to RSS Feed
- Mark Topic as New
- Mark Topic as Read
- Float this Topic for Current User
- Bookmark
- Subscribe
- Mute
- Printer Friendly Page
- Mark as New
- Bookmark
- Subscribe
- Mute
- Subscribe to RSS Feed
- Permalink
- Report Inappropriate Content
help with expression - aggregation DIFFERENT MONTHS
Hi!
Please could someone help me with this expression problem.
the aggregation was working perfectly, until I added the months as dimensions, and I'm not getting to rebuild the expression so that I'll have the right value each month.
total values by month should be as the first chart.
find the file attached here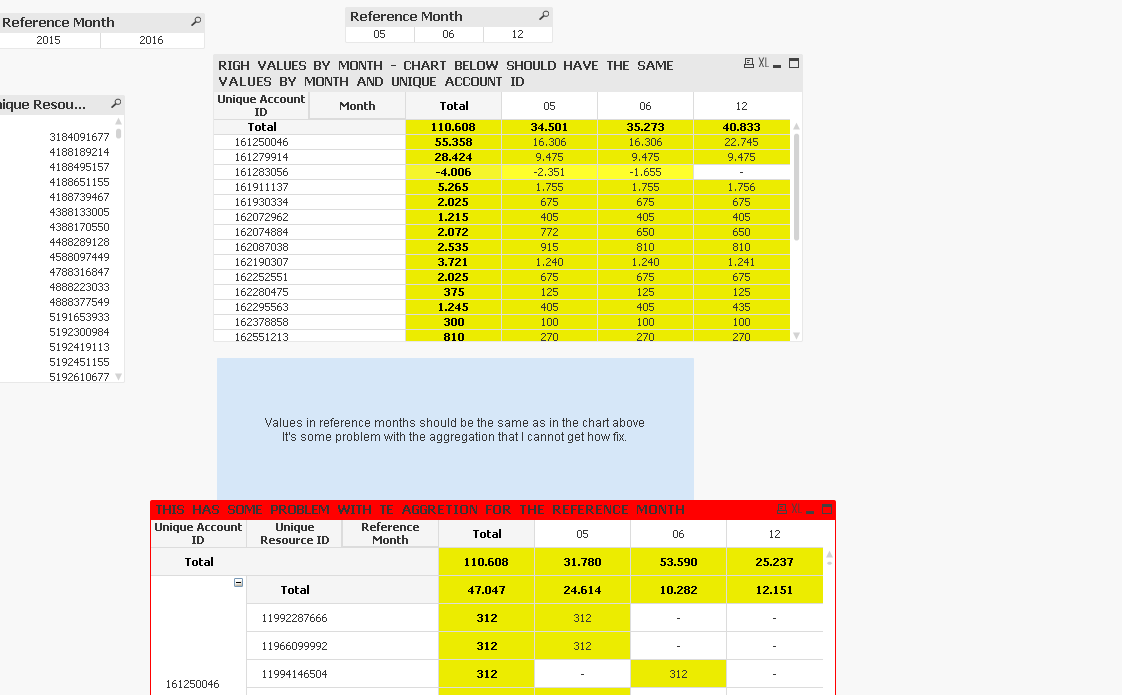
- « Previous Replies
-
- 1
- 2
- Next Replies »
- Mark as New
- Bookmark
- Subscribe
- Mute
- Subscribe to RSS Feed
- Permalink
- Report Inappropriate Content
Can you check if this is what is needed:
Avg({<[Unique Resource ID] = {"=Len(Trim([Unique Resource ID])) > 0"}>} 1) *
RangeSum(
Sum(TOTAL <[Unique Account ID], [Reference Month]> {<[Adjust Type]= {'C'}, [Registry ID] = {'70'}, [Adjust Signal] = {'-'}>} [Adjust Amount]*(-1)/100),
Sum(TOTAL <[Unique Account ID], [Reference Month]> {<[Adjust Type]= {'C'}, [Registry ID] = {'70'}, [Adjust Signal] = {'+'}>} [Adjust Amount]/100),
Sum(TOTAL <[Unique Account ID], [Reference Month]> {<[Discount Type] = {'C'}, [Discount Signal] = {'-'}>} [Discount Amount]*(-1)/100),
Sum(TOTAL <[Unique Account ID], [Reference Month]> {<[Plan Type] = {'C'}, [Registry ID] = {'60'}>} [Plan Amount with Taxes]/100))
/
If(Dimensionality() = 3, Count(TOTAL <[Unique Account ID], [Reference Month]> DISTINCT {<[Unique Resource ID] = {"=Len(Trim([Unique Resource ID])) > 0"}>} [Unique Resource ID]), 1)
- Mark as New
- Bookmark
- Subscribe
- Mute
- Subscribe to RSS Feed
- Permalink
- Report Inappropriate Content
Hi Sunny, when I collapse all the information and stay only with cost center showing the values showed for cost center are not correct.
could you please help me once more?
thanks
- « Previous Replies
-
- 1
- 2
- Next Replies »