Unlock a world of possibilities! Login now and discover the exclusive benefits awaiting you.
- Qlik Community
- :
- All Forums
- :
- QlikView App Dev
- :
- Re: how can I display error bars values in a bar g...
- Subscribe to RSS Feed
- Mark Topic as New
- Mark Topic as Read
- Float this Topic for Current User
- Bookmark
- Subscribe
- Mute
- Printer Friendly Page
- Mark as New
- Bookmark
- Subscribe
- Mute
- Subscribe to RSS Feed
- Permalink
- Report Inappropriate Content
how can I display error bars values in a bar graph?
Hi everybody!
I have a bar graph with error bars used as limits for each bar, my problem is that I need to show the error bars values as you can see in the image below... is there a way to do it?
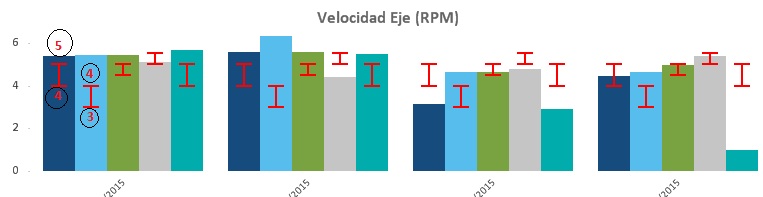
Any idea is welcome. Thank you!
Linda
- Tags:
- error bars
- Mark as New
- Bookmark
- Subscribe
- Mute
- Subscribe to RSS Feed
- Permalink
- Report Inappropriate Content
HI If you expand the expression (+ value) u will see the different options, select the show value and write the error expression, it will display only error values on the chart.
Hope this helps.
Thanks
- Mark as New
- Bookmark
- Subscribe
- Mute
- Subscribe to RSS Feed
- Permalink
- Report Inappropriate Content
Thank you shree909... I have tried to use this option but it only displays the bar value. It does not display the expression I write on the definition. I have read that this option only accept logic definition in order to show or not the bar value, that's it. I can't show other value there...
Did it work for you? How did you do it?
- Mark as New
- Bookmark
- Subscribe
- Mute
- Subscribe to RSS Feed
- Permalink
- Report Inappropriate Content
Perhaps using "Text in Chart" on the Presentation Tab could solve your problem.
- Mark as New
- Bookmark
- Subscribe
- Mute
- Subscribe to RSS Feed
- Permalink
- Report Inappropriate Content
can you please share the sample app to look into it..?
- Mark as New
- Bookmark
- Subscribe
- Mute
- Subscribe to RSS Feed
- Permalink
- Report Inappropriate Content
Yes Pravesh I am using this option for the moment (as a legend), because I don't have other alternative. Thank you.
- Mark as New
- Bookmark
- Subscribe
- Mute
- Subscribe to RSS Feed
- Permalink
- Report Inappropriate Content
Don't worry... I am using the "text in chart" option in order to solve my problem. Thank you.
- Mark as New
- Bookmark
- Subscribe
- Mute
- Subscribe to RSS Feed
- Permalink
- Report Inappropriate Content
It would be nice to see your Text in Chart solution. What did you put in that box to accomplish your goal?