Unlock a world of possibilities! Login now and discover the exclusive benefits awaiting you.
- Qlik Community
- :
- All Forums
- :
- QlikView App Dev
- :
- Re: how can I show number in a legend that is diff...
- Subscribe to RSS Feed
- Mark Topic as New
- Mark Topic as Read
- Float this Topic for Current User
- Bookmark
- Subscribe
- Mute
- Printer Friendly Page
- Mark as New
- Bookmark
- Subscribe
- Mute
- Subscribe to RSS Feed
- Permalink
- Report Inappropriate Content
how can I show number in a legend that is different from the expr.
Hi,
I have a pie chart that shows number of account holders in different income group. I want to show in legends % growth of accounts compared to last year for each of the income group.
I create 2 expressions, 1 for count of accounts and other for % growth. The pie shows the count of accounts properly. Now in legends how do I see the 2nd expression against the legends.
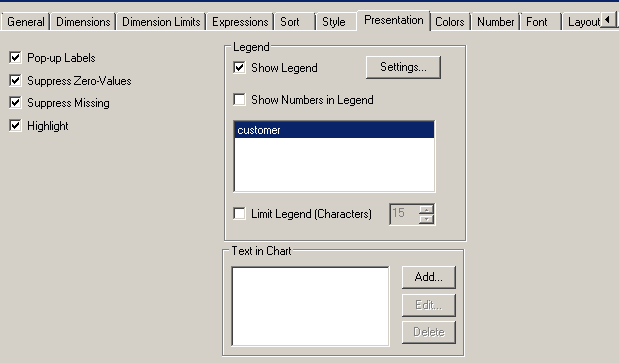
In the presentation tab, when I tick 'show numbers in legends' it actually shows count of accounts and not the % growth which is my 2nd expression.
Any solution to this is appreciated.
Thanks
Lax
- Mark as New
- Bookmark
- Subscribe
- Mute
- Subscribe to RSS Feed
- Permalink
- Report Inappropriate Content
Put your growth expression in the label of the first expression.
- Mark as New
- Bookmark
- Subscribe
- Mute
- Subscribe to RSS Feed
- Permalink
- Report Inappropriate Content
I assume you want to have both values displayed.
Depending on how static your pie chart is, and therefore your legend, adding a Text in Chart with a dynamic expression might be a good idea.
- Mark as New
- Bookmark
- Subscribe
- Mute
- Subscribe to RSS Feed
- Permalink
- Report Inappropriate Content
Add a Text in Chart Expression, you can do this in the presentation tab
See below

- Mark as New
- Bookmark
- Subscribe
- Mute
- Subscribe to RSS Feed
- Permalink
- Report Inappropriate Content
I do want to have 2 values displayed in the chart. No. of accounts is already displayed in the pie chart. So the size of the pie is based on the no. of accounts. Now in the same chart If I want to show % growth, I guess it should have allowed me in the legends as I am already displaying legends with numbers so these numbers should be % growth and not the account count .
Adding text in chart does not help me. as it shows the % growth overall and not as per the account holder income.
Not sure how the dynamic expression can help me in it.
- Mark as New
- Bookmark
- Subscribe
- Mute
- Subscribe to RSS Feed
- Permalink
- Report Inappropriate Content
Well, technically it only makes sense to display the number corresponding to the pie chart.
A dynamic expression would look a little bit like:
=num(expression1({$<dimension*={first value of dimension}>}),'numberformat') &' / ' & num(expression2({$<dimension*={first value of dimension}>}),'numberformat') & char(10) & [second value of dimension etc...]
chr(10) represents a line break.