Unlock a world of possibilities! Login now and discover the exclusive benefits awaiting you.
- Qlik Community
- :
- All Forums
- :
- QlikView App Dev
- :
- how can we show the sum /avg of some bar in anothe...
- Subscribe to RSS Feed
- Mark Topic as New
- Mark Topic as Read
- Float this Topic for Current User
- Bookmark
- Subscribe
- Mute
- Printer Friendly Page
- Mark as New
- Bookmark
- Subscribe
- Mute
- Subscribe to RSS Feed
- Permalink
- Report Inappropriate Content
how can we show the sum /avg of some bar in another bar in same bar chart
Please let me know how can i get the following like scenario.. follow the image....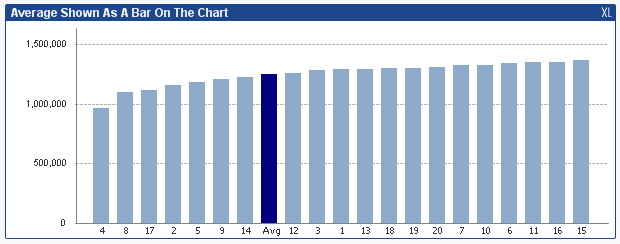
how can i create the above avg bar in the chart or like the same if i need to create it for the sum of the previous bar so how can i do it...???
- Mark as New
- Bookmark
- Subscribe
- Mute
- Subscribe to RSS Feed
- Permalink
- Report Inappropriate Content
Hi Vasudha,
I think in this case you had Avg as dimension value along with 1,2,3......,Can you share your data?
Regards
KC
KC
- Mark as New
- Bookmark
- Subscribe
- Mute
- Subscribe to RSS Feed
- Permalink
- Report Inappropriate Content
May be like attached sample.
- Mark as New
- Bookmark
- Subscribe
- Mute
- Subscribe to RSS Feed
- Permalink
- Report Inappropriate Content
Hi Vasudha,
share your sample application to get close result
- Mark as New
- Bookmark
- Subscribe
- Mute
- Subscribe to RSS Feed
- Permalink
- Report Inappropriate Content
can u pls send me a image file of the above its not opening on my system
- Mark as New
- Bookmark
- Subscribe
- Mute
- Subscribe to RSS Feed
- Permalink
- Report Inappropriate Content
Dear,
are you looking like below.

- Mark as New
- Bookmark
- Subscribe
- Mute
- Subscribe to RSS Feed
- Permalink
- Report Inappropriate Content
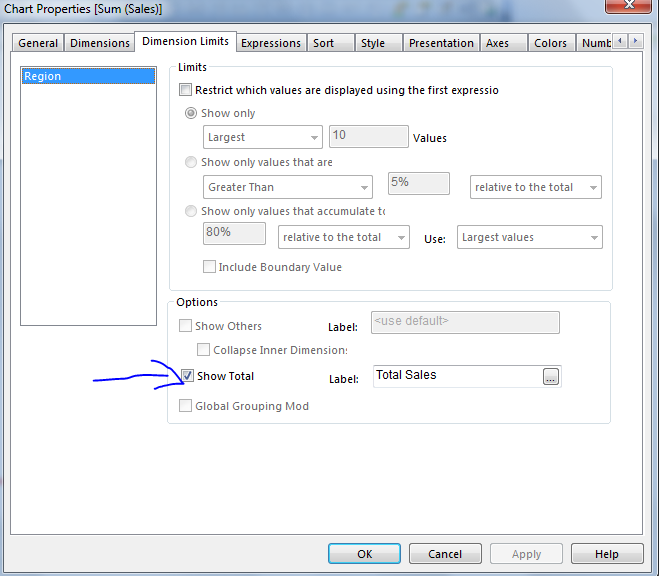
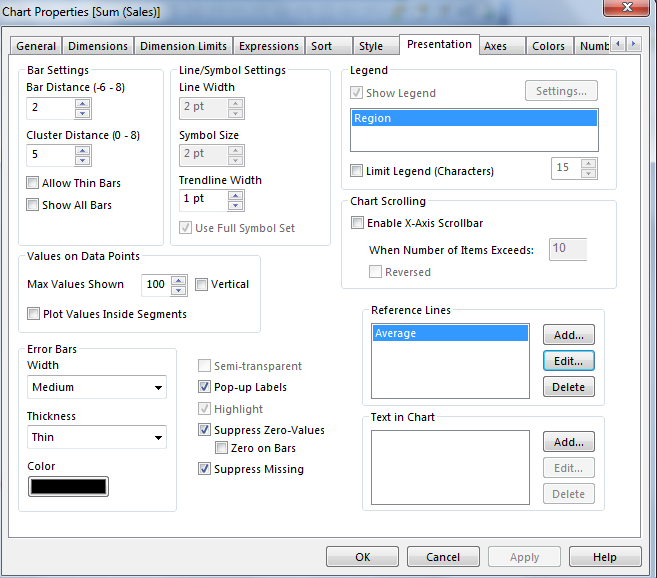
Check these screen shots attached
- Mark as New
- Bookmark
- Subscribe
- Mute
- Subscribe to RSS Feed
- Permalink
- Report Inappropriate Content
Dear,
yes i am looking for almost the same as above.but i need to create the total sum of first two bar data values in third bar ,then rest the same.....pls help me in that...
as for the above example i have to create the sum of data values of GERMANY and SPAIN in the another third consecutive bar before UK......please let me know....