Unlock a world of possibilities! Login now and discover the exclusive benefits awaiting you.
- Qlik Community
- :
- All Forums
- :
- QlikView App Dev
- :
- Re: how get top 10 customers with excluding negati...
- Subscribe to RSS Feed
- Mark Topic as New
- Mark Topic as Read
- Float this Topic for Current User
- Bookmark
- Subscribe
- Mute
- Printer Friendly Page
- Mark as New
- Bookmark
- Subscribe
- Mute
- Subscribe to RSS Feed
- Permalink
- Report Inappropriate Content
how get top 10 customers with excluding negative values from report?
Hi All,
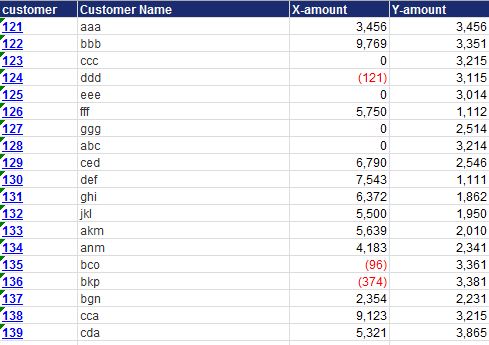
as per our requirement we need to show top 10 customers from below chart and that top 10 records should be display based on Y-amount with excluding negative values from X-amount filed.means by excluding negative values from chart need to get top 10 values and I already tried using Rank function in the calculated dimension but I got only top 7 records only,means still it is considered negative values from X-amount.
Please suggest solution on this.
- Mark as New
- Bookmark
- Subscribe
- Mute
- Subscribe to RSS Feed
- Permalink
- Report Inappropriate Content
Can you share some sample data, as this is an image it is kind of time consuming to create from scratch and also your expected output. Here your figures from X Amount in RED are the negative values? What you mean negative values from X amount?
- Mark as New
- Bookmark
- Subscribe
- Mute
- Subscribe to RSS Feed
- Permalink
- Report Inappropriate Content
Hi Nagaraju,
The red color values negative values from x-amount. I want to exclude this values from chart and need to get top 10 customers within same chart with all dimensions and measures as usually.
- Mark as New
- Bookmark
- Subscribe
- Mute
- Subscribe to RSS Feed
- Permalink
- Report Inappropriate Content
Can you share a sample app with above data ?
- Mark as New
- Bookmark
- Subscribe
- Mute
- Subscribe to RSS Feed
- Permalink
- Report Inappropriate Content
like this ???
if (aggr (rank(sum( {<x-amount={">0"}>}Y-amount), customer)<=10,customer,'Others')
- Mark as New
- Bookmark
- Subscribe
- Mute
- Subscribe to RSS Feed
- Permalink
- Report Inappropriate Content
maybe
=aggr(if(rank(sum({$ <Customer={"=sum(X)>0"}>} Y))<=10 and sum(X)>0, Customer), Customer)
- Mark as New
- Bookmark
- Subscribe
- Mute
- Subscribe to RSS Feed
- Permalink
- Report Inappropriate Content
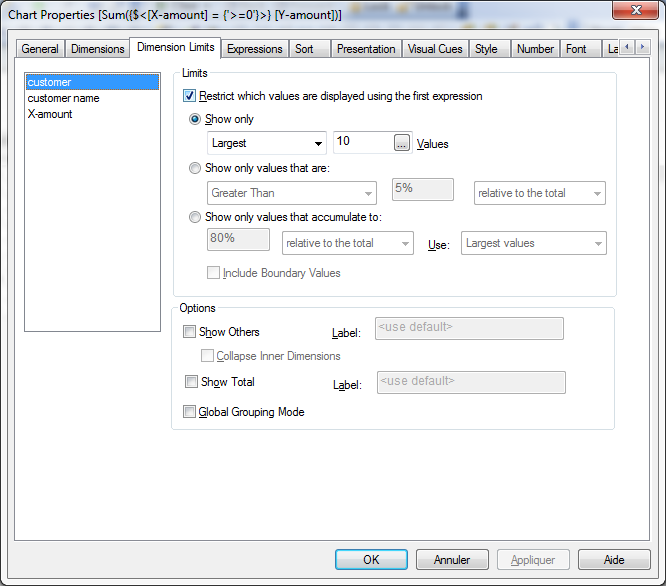
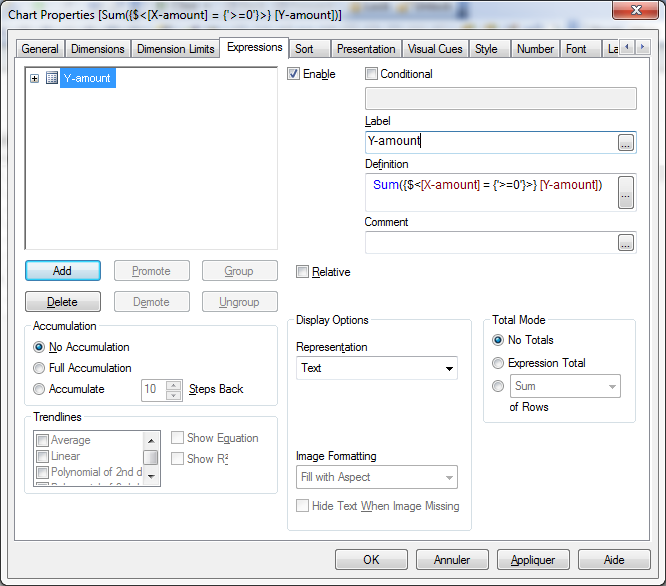
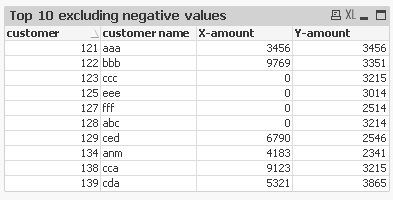
have you tried simply using this in your expression:
=sum({$<X-Amount={">0"}>} Y-Amount)
And then just use dimension limits?
Or you could use what you already have and just make the Y-Amount expression be
if(X-Amount<0,'',Y-Amount)
Then that Y-Amount value would never be in the top 10.
- Mark as New
- Bookmark
- Subscribe
- Mute
- Subscribe to RSS Feed
- Permalink
- Report Inappropriate Content
Hi Srinivas,
you can try this
Regards,
Robert V.