Unlock a world of possibilities! Login now and discover the exclusive benefits awaiting you.
- Qlik Community
- :
- All Forums
- :
- QlikView App Dev
- :
- how to change the alternate segments color of sing...
- Subscribe to RSS Feed
- Mark Topic as New
- Mark Topic as Read
- Float this Topic for Current User
- Bookmark
- Subscribe
- Mute
- Printer Friendly Page
- Mark as New
- Bookmark
- Subscribe
- Mute
- Subscribe to RSS Feed
- Permalink
- Report Inappropriate Content
how to change the alternate segments color of single line chart in qlikview
Hi,
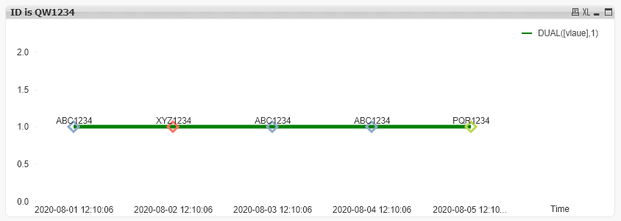
Does anyone know how to change the color of alternate segments in a single line chart ?
I have datetime on X axis and text value on measure, I want to change the color of the segment based on the comparison of current to next value (if they are same then use one color, otherwise another color)or altleast alternate segments to different color.
Thanks,
Matrix
- Tags:
- qlikview_scripting
Accepted Solutions
- Mark as New
- Bookmark
- Subscribe
- Mute
- Subscribe to RSS Feed
- Permalink
- Report Inappropriate Content
Check the attached file. You would need one additional expression with only symbol presentation and background expression something like:
Color(FieldIndex('vlaue', vlaue))
- Mark as New
- Bookmark
- Subscribe
- Mute
- Subscribe to RSS Feed
- Permalink
- Report Inappropriate Content
Try to share a sample app to work on.
- Mark as New
- Bookmark
- Subscribe
- Mute
- Subscribe to RSS Feed
- Permalink
- Report Inappropriate Content
Hi treseco,
Attaching you a sample qvw file..I want to see segments ABC1234 in green color (it is appearing 2 times) and XYZ1234 is a different value, so different color.
Can this be done in qlikview?
I mean it is a single line but i want to show the segments (symbols) on the data values with different color...usually i have toggling values 2, and i dnt want to code in inline table...
for example in straight table we can change the alternate rows color by using something like
=if(mod(rowno(total),2)=0,red(),green())
i want to change alternate symbols in line with different color..
thanks.
- Mark as New
- Bookmark
- Subscribe
- Mute
- Subscribe to RSS Feed
- Permalink
- Report Inappropriate Content
Check the attached file. You would need one additional expression with only symbol presentation and background expression something like:
Color(FieldIndex('vlaue', vlaue))
- Mark as New
- Bookmark
- Subscribe
- Mute
- Subscribe to RSS Feed
- Permalink
- Report Inappropriate Content
Thank you Tresesco..
It worked well for me..:-)
- Mark as New
- Bookmark
- Subscribe
- Mute
- Subscribe to RSS Feed
- Permalink
- Report Inappropriate Content
You would need one additional expression with only symbol presentation and background expression something like:
Color(FieldIndex('vlaue', vlaue)) .
Also you can add conditional color expression in the Main expression.
- Mark as New
- Bookmark
- Subscribe
- Mute
- Subscribe to RSS Feed
- Permalink
- Report Inappropriate Content
And also it can be done in the single expression as well (by selecting both line and symbol), works well.
I accepted your solution as Color using Fieldindex given me what i was looking for...
