Unlock a world of possibilities! Login now and discover the exclusive benefits awaiting you.
- Qlik Community
- :
- All Forums
- :
- QlikView App Dev
- :
- Re: how to create new report from two existing cha...
- Subscribe to RSS Feed
- Mark Topic as New
- Mark Topic as Read
- Float this Topic for Current User
- Bookmark
- Subscribe
- Mute
- Printer Friendly Page
- Mark as New
- Bookmark
- Subscribe
- Mute
- Subscribe to RSS Feed
- Permalink
- Report Inappropriate Content
how to create new report from two existing chart expressions on a sheet
I want to check two columns (survey id) from two specific chart expressions in the same sheet..
If the two columns match then the comment section will say yes, if for a corresponding survey id that value is missing in the other column it will display No..it was not possible to link these two tables in the script level so i had no choice to put them into expressions...how can you compare columns from two specific chart expressions in qlikview? Is it possible? Or should I use trigger to generate prompt message whenever there is no match is found for a specific survey id
- Mark as New
- Bookmark
- Subscribe
- Mute
- Subscribe to RSS Feed
- Permalink
- Report Inappropriate Content
not sure if it meets your requirments:
if you do a Count on fields of the two different Charts and look if both have Count > 0
if (count(Vessel)>0 and count(STATUS_OVERVIEW)>0, 'Yes','No')

- Mark as New
- Bookmark
- Subscribe
- Mute
- Subscribe to RSS Feed
- Permalink
- Report Inappropriate Content
I want to compare the left hand mother tabe with the righter one and generate status on the basis of that...
For example:
 This is my requirement..so is it possible by the way u described?
- Mark as New
- Bookmark
- Subscribe
- Mute
- Subscribe to RSS Feed
- Permalink
- Report Inappropriate Content
can you post example qvw? why the Grey Survey_id is different than the yellow one. is it a cartesian product?
- Mark as New
- Bookmark
- Subscribe
- Mute
- Subscribe to RSS Feed
- Permalink
- Report Inappropriate Content
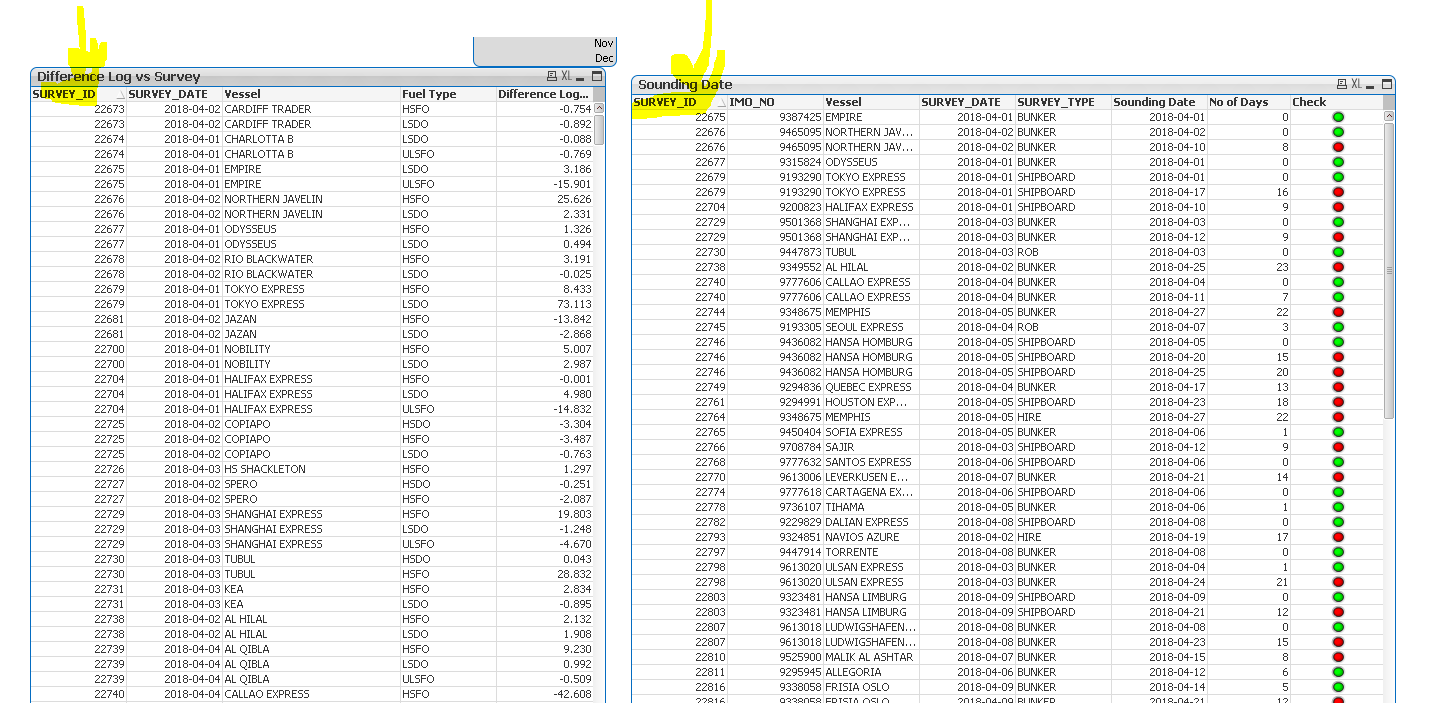
i have uploaded the qvw..The left side comes from one database whiule the right one from another databse.I had to join them with IMO no and used some date range as it was hard to join..but now we have both the data in the chart expression.so i want to compare them directly and have a status overview as required...the yellow comes from the Difference Log vs Survey table and th grey from the other one.I just want to compare the survey id of the two charts and have status overview yes, no
- Mark as New
- Bookmark
- Subscribe
- Mute
- Subscribe to RSS Feed
- Permalink
- Report Inappropriate Content
I donot know exactly what you Need. the above table with yellow columns are not in your qvw?
I see two table "Difference Log vs Survey" and "Sounding Date".Do you want to vcombine These table into a new one?
- Mark as New
- Bookmark
- Subscribe
- Mute
- Subscribe to RSS Feed
- Permalink
- Report Inappropriate Content
both tables are in my qvw...and the yellow and grey column both are coming from the same sheet..i just coloured them and extracted into excel to show u ..i just want to compare the survey ids present in difference vs log and sounding date and then have a status overview dependng on the match....yes it would be like a new table with status (yes or no) coming from these two charts....
- Mark as New
- Bookmark
- Subscribe
- Mute
- Subscribe to RSS Feed
- Permalink
- Report Inappropriate Content
maybe like this:
a) example with no

b) example with yes

c) together

table contains 4 dimensions and 1 Expression:
if (aggr(count(Vessel),IMO_NO)>0 and aggr(count(BUNKER_DELIVERY_NOTE_NUMBER),SURVEY_ID)>0, 'Yes','No')
- Mark as New
- Bookmark
- Subscribe
- Mute
- Subscribe to RSS Feed
- Permalink
- Report Inappropriate Content
 But this is not right..as it exists...we can see 22675 in both the regions...