Unlock a world of possibilities! Login now and discover the exclusive benefits awaiting you.
- Qlik Community
- :
- All Forums
- :
- QlikView App Dev
- :
- how to display last 12 cumulative months from a ti...
- Subscribe to RSS Feed
- Mark Topic as New
- Mark Topic as Read
- Float this Topic for Current User
- Bookmark
- Subscribe
- Mute
- Printer Friendly Page
- Mark as New
- Bookmark
- Subscribe
- Mute
- Subscribe to RSS Feed
- Permalink
- Report Inappropriate Content
how to display last 12 cumulative months from a time series
Hi
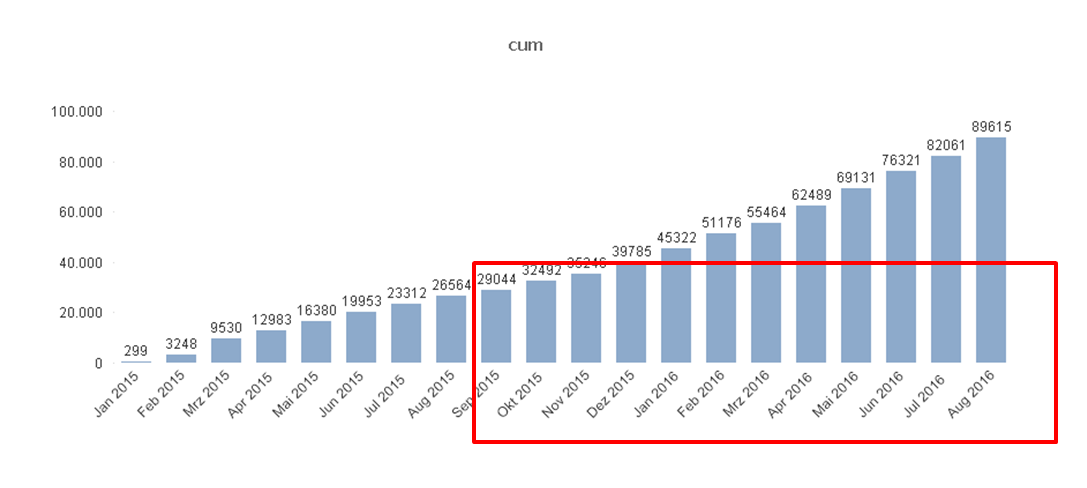
I am getting stucked here, I want to display the last 12 months from the selected month, The selected month is in this case Aug 2016. I Need to Display the cumulated values as shown in the figure, i.e., not taking Sep 2015 as the first month to start the cumulation, but using always Jan 2015 as first month of the cumulation.
Any ideas on how to show the Chart in this form, without loosing the cumulative values ?
thanks
PD: $(vL.ToMonth) = max(%date_monthyear__id)
$(vL.FromMonth) = $(vL.FromMonth) -12
the Formula Looks like this:
=sum({$<date_year=,date_monthyear=,date_month=, %date_monthyear__id={">=$(=min({1}%date_monthyear__id))<=$(vL.FromMonth)"} >}registrations_sum)
+
rangesum(Above( sum({$<date_year=,date_monthyear=,date_month=, %date_monthyear__id={">$(vL.FromMonth)<=$(vL.ToMonth)"} >}registrations_sum) ,0,Rowno()))
- Mark as New
- Bookmark
- Subscribe
- Mute
- Subscribe to RSS Feed
- Permalink
- Report Inappropriate Content
Also search the community for Rolling Total, there is lot of content available
If a post helps to resolve your issue, please accept it as a Solution.
- Mark as New
- Bookmark
- Subscribe
- Mute
- Subscribe to RSS Feed
- Permalink
- Report Inappropriate Content
thanks