Unlock a world of possibilities! Login now and discover the exclusive benefits awaiting you.
- Qlik Community
- :
- All Forums
- :
- QlikView App Dev
- :
- how to display quaters expression value in bar ch...
- Subscribe to RSS Feed
- Mark Topic as New
- Mark Topic as Read
- Float this Topic for Current User
- Bookmark
- Subscribe
- Mute
- Printer Friendly Page
- Mark as New
- Bookmark
- Subscribe
- Mute
- Subscribe to RSS Feed
- Permalink
- Report Inappropriate Content
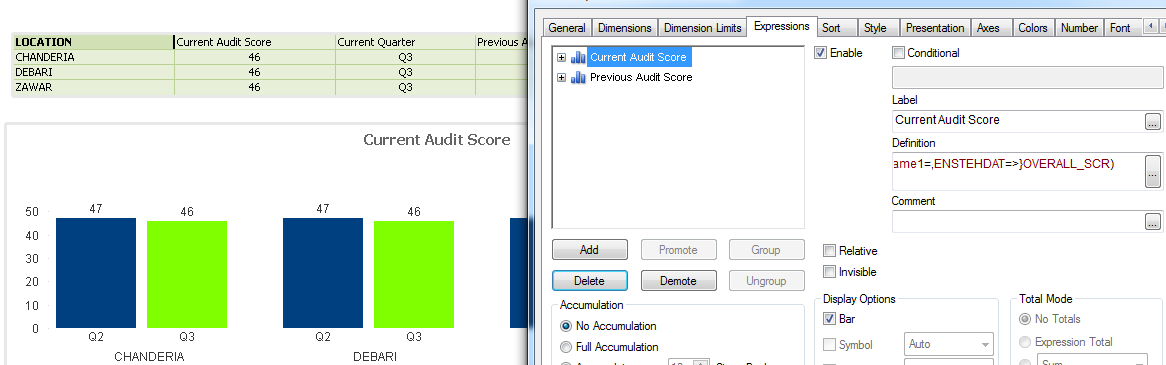
how to display quaters expression value in bar chart
Hello All,
i am trying to convert my straight table into bar chart,the problem is......i cant able to display quarters expression value...how to display then as well?.....
dimension:LOCATION
expression1:current score
exp2(current quarter) :FirstSortedValue(QUARTER,-ADATE)
exp3: previous score
exp4(previous quarter):FirstSortedValue(QUARTER,-ADATE,2)
exp2 and exp4 are missing
please fins the attachment .......
- « Previous Replies
- Next Replies »
- Mark as New
- Bookmark
- Subscribe
- Mute
- Subscribe to RSS Feed
- Permalink
- Report Inappropriate Content
You Need to remove the 2nd and 4th expression which you have placed to show the quarters..
You dont need them.
Regards,
Kaushik Solanki
- Mark as New
- Bookmark
- Subscribe
- Mute
- Subscribe to RSS Feed
- Permalink
- Report Inappropriate Content
First you need to move the current Quarter and Previous Quarter expressions to the top. 2nd You need to uncheck the option next to bar
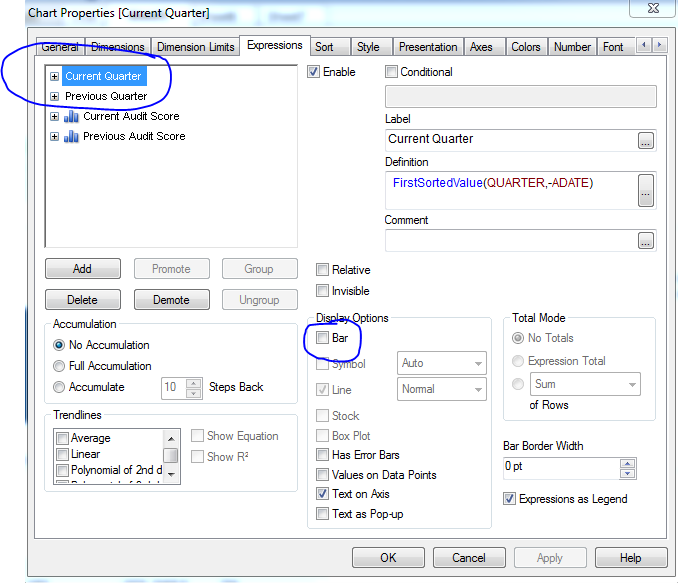
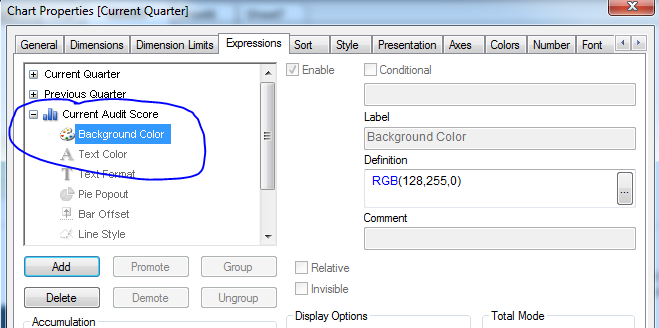
Third assign the bar colors based on the Background color
- Mark as New
- Bookmark
- Subscribe
- Mute
- Subscribe to RSS Feed
- Permalink
- Report Inappropriate Content
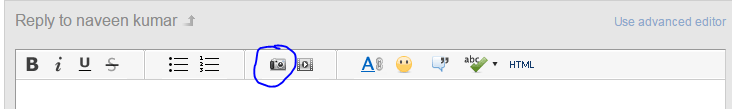
Hi,
how ur copying this screen shorts and pasting them .....if i need to display something only thing i known is print screen and copy them in to ppt then attach them which is a long process ...can u let me known how to do this..plz
- Mark as New
- Bookmark
- Subscribe
- Mute
- Subscribe to RSS Feed
- Permalink
- Report Inappropriate Content
- Mark as New
- Bookmark
- Subscribe
- Mute
- Subscribe to RSS Feed
- Permalink
- Report Inappropriate Content
HI,
is this the max we can do?
one last question how to separate the quarter value ... i am getting values in one column ...can to get display like your one
- Mark as New
- Bookmark
- Subscribe
- Mute
- Subscribe to RSS Feed
- Permalink
- Report Inappropriate Content
You are getting it in one column? I am not sure I understand your question
- Mark as New
- Bookmark
- Subscribe
- Mute
- Subscribe to RSS Feed
- Permalink
- Report Inappropriate Content
HI
PLEASE FIND THE ATTACHMENT
- Mark as New
- Bookmark
- Subscribe
- Mute
- Subscribe to RSS Feed
- Permalink
- Report Inappropriate Content
Naveen try this:
1) Add Quarter as your Dimension
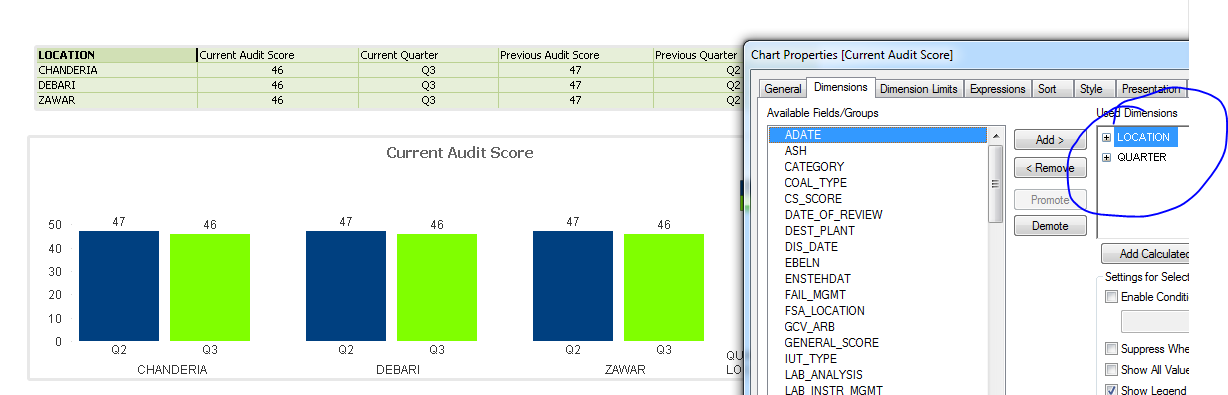
2) Remove the two text on axis expressions
- Mark as New
- Bookmark
- Subscribe
- Mute
- Subscribe to RSS Feed
- Permalink
- Report Inappropriate Content
i have changed the expression ,then its all messed can you help me
- « Previous Replies
- Next Replies »