Unlock a world of possibilities! Login now and discover the exclusive benefits awaiting you.
- Qlik Community
- :
- All Forums
- :
- QlikView App Dev
- :
- Re: how to display top 5 customers in pivot table
- Subscribe to RSS Feed
- Mark Topic as New
- Mark Topic as Read
- Float this Topic for Current User
- Bookmark
- Subscribe
- Mute
- Printer Friendly Page
- Mark as New
- Bookmark
- Subscribe
- Mute
- Subscribe to RSS Feed
- Permalink
- Report Inappropriate Content
how to display top 5 customers in pivot table
hi all,
i m facing problem in displaying top five customers in pivot table ,which i want to determine from 'item_netamt; field. in mkg_sale_details table there is multiple 'item_netamt; entries against customers .i want to get top 5 customers on the basis of top 5 sum('item_netamt;) per customer.
is there any function which can be used in chart expression to get the desired.
thanks!!!
- Tags:
- dimension
Accepted Solutions
- Mark as New
- Bookmark
- Subscribe
- Mute
- Subscribe to RSS Feed
- Permalink
- Report Inappropriate Content
thanx for reply!!
but i still have some problem in it, it displays 'error in calculated expression' in pivot table.
for your help, i have four fields in pivot table, which are country,state,city, sum(item_netamt) apart from top 5 customers. all fields are coming from different tables which are associated in qlikview.
- Mark as New
- Bookmark
- Subscribe
- Mute
- Subscribe to RSS Feed
- Permalink
- Report Inappropriate Content
Hi,
You can use the sraight table and sort the expression values in descending order.
Then,on the presentation tab you can mention "Max Number(1-100)=5.
Thanks.
- Mark as New
- Bookmark
- Subscribe
- Mute
- Subscribe to RSS Feed
- Permalink
- Report Inappropriate Content
Hi,
Use aggr function with Rank in combination:
below is to show Top 10 Category for jul 2009 basis count of call no
if(aggr(rank(Count(If(Open_Period='Jul 2009',Callno))),Catagory)<=10,Catagory)
- Mark as New
- Bookmark
- Subscribe
- Mute
- Subscribe to RSS Feed
- Permalink
- Report Inappropriate Content
Hi
To do this, you would use the Aggr and Rank functions on the expression you have in your pivot table.
Let's assume you have only one dimension called Customer in the pivot, and that you have only one expression which is Sum(Item_NetAmt), in this case you would amend your expression as follows:
= IF ( Aggr ( Rank ( Sum ( Item_NetAmt ) , Customer ) <= 5 , Sum ( Item_NetAmt ) )
So, what you are doing here is aggregating the sum of item_netamt over the customer dimension and then checking that the rank of that aggregation is up to 5, if it is then show the sum, ohterwise show nothing.
Note: If you have more than one dimension in your pivot then you should make sure that the aggregation (Aggr) function recognises that by including those dimensions in the aggr function.
Good luck,
- Mark as New
- Bookmark
- Subscribe
- Mute
- Subscribe to RSS Feed
- Permalink
- Report Inappropriate Content
thanx for reply!!
but i still have some problem in it, it displays 'error in calculated expression' in pivot table.
for your help, i have four fields in pivot table, which are country,state,city, sum(item_netamt) apart from top 5 customers. all fields are coming from different tables which are associated in qlikview.
- Mark as New
- Bookmark
- Subscribe
- Mute
- Subscribe to RSS Feed
- Permalink
- Report Inappropriate Content
Hi
If you have more than one dimension in your pivot then you must recognise this in the Aggr function that you use. You should remember that the Aggr function moves outside of any dimensions that exist in the chart, which means that it will ignore those dimensions and aggregate according to what you tell it to aggregate.
The expression I gave you was:
= IF ( Aggr ( Rank ( Sum ( Item_NetAmt ) , Customer ) <= 5 , Sum ( Item_NetAmt ) )
However, if you have Country, State, City (in that order) in your pivot table as dimensions, then you should create an expression as follows:
= IF ( Aggr ( Rank ( Sum ( item_netamt ) , Country, State, City ) <= 5 , Sum ( item_netamt ) )
If you are still getting the error message after doing this, could you pop an example of your application onto the thread and I'll take a look.
Regards,
- Mark as New
- Bookmark
- Subscribe
- Mute
- Subscribe to RSS Feed
- Permalink
- Report Inappropriate Content
Hi Newlearner,
The original formula
= IF ( Aggr ( Rank ( Sum ( Item_NetAmt ) , Customer ) <= 5 ), Sum ( Item_NetAmt ) ) has one right parenthesis misplaced.
The correct fomula should read :
= IF ( Aggr ( Rank ( Sum ( Item_NetAmt )) , Customer ) <= 5 , Sum ( Item_NetAmt ) )
regards,
- Mark as New
- Bookmark
- Subscribe
- Mute
- Subscribe to RSS Feed
- Permalink
- Report Inappropriate Content
Good morning! friend
I am facing the same problem and I need your help
I try to display the first 10 sales per country in a Pivot table
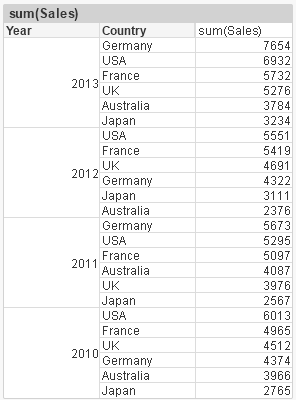
so I added this expression in dimensions
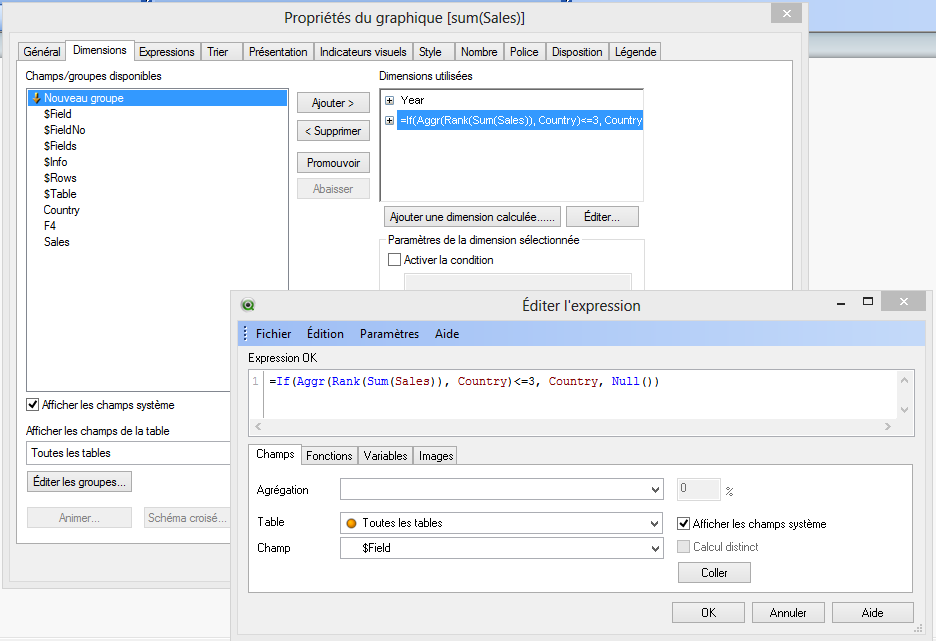
and as a result I have

as you can see for 2010 it gives a result USA-> France-> germany and the logical order is USA-> France-> UK
why?
Thank you for your answers