Unlock a world of possibilities! Login now and discover the exclusive benefits awaiting you.
- Qlik Community
- :
- All Forums
- :
- QlikView App Dev
- :
- how to do cycle group in bar chart with different ...
- Subscribe to RSS Feed
- Mark Topic as New
- Mark Topic as Read
- Float this Topic for Current User
- Bookmark
- Subscribe
- Mute
- Printer Friendly Page
- Mark as New
- Bookmark
- Subscribe
- Mute
- Subscribe to RSS Feed
- Permalink
- Report Inappropriate Content
how to do cycle group in bar chart with different dimentions
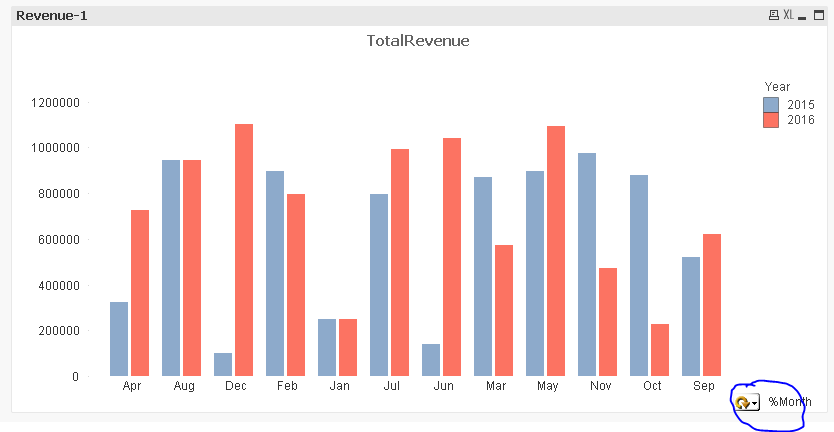
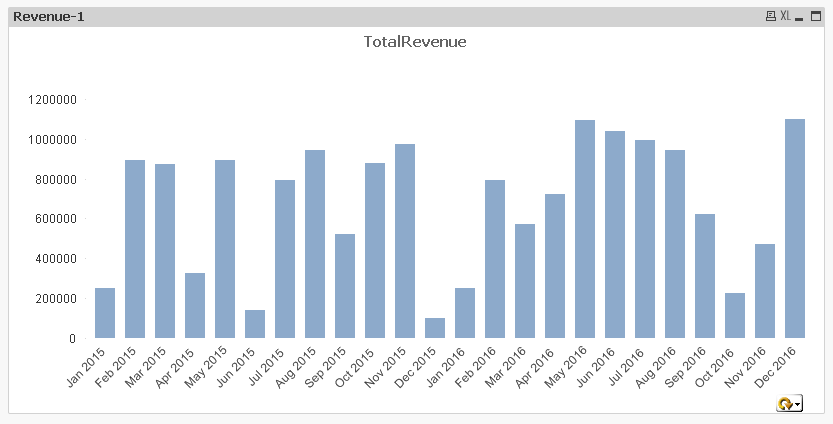
I have 2 bar charts I don't know how to combine them to make a cycle group.
attached example.
Thanks
Pavithra Shetty
Accepted Solutions
- Mark as New
- Bookmark
- Subscribe
- Mute
- Subscribe to RSS Feed
- Permalink
- Report Inappropriate Content
- Mark as New
- Bookmark
- Subscribe
- Mute
- Subscribe to RSS Feed
- Permalink
- Report Inappropriate Content
In the dimension tab of your chart, near the bottom under your table list, click 'edit group's
create a new group and select the dimensions for the group, my best guess is %Month and &year
select either cyclic or drill down
A similar process can be done for your expressions too. By creating 2 expressions, putting them next to each other and clicking 'group', you can cycle through expressions as well.
So, you can have a Sum(Sales) by month, by year, or sum(salary) by the same dimensions.
- Mark as New
- Bookmark
- Subscribe
- Mute
- Subscribe to RSS Feed
- Permalink
- Report Inappropriate Content
Look at the chart now and see if this is what you wanted
- Mark as New
- Bookmark
- Subscribe
- Mute
- Subscribe to RSS Feed
- Permalink
- Report Inappropriate Content
Exactly! Awesome job! Thank you so much. I'm poor at grouping. Thank you, thank you.