Unlock a world of possibilities! Login now and discover the exclusive benefits awaiting you.
- Qlik Community
- :
- All Forums
- :
- QlikView App Dev
- :
- how to dynamically change the chart?
- Subscribe to RSS Feed
- Mark Topic as New
- Mark Topic as Read
- Float this Topic for Current User
- Bookmark
- Subscribe
- Mute
- Printer Friendly Page
- Mark as New
- Bookmark
- Subscribe
- Mute
- Subscribe to RSS Feed
- Permalink
- Report Inappropriate Content
how to dynamically change the chart?
Hi all
i have dimensions country,region,state,year,month.
first chart show the country wise sales.after with out user selection chart show region ,month,year wise sales.automatically it will change the dimension .how?
- Mark as New
- Bookmark
- Subscribe
- Mute
- Subscribe to RSS Feed
- Permalink
- Report Inappropriate Content
Hi
you can create cyclic group(Year,month) or drilldown(Country,region, state) group .Then you can use the these group as dimension in chart and
in expression tab write the expression.
Regards
tripati
- Mark as New
- Bookmark
- Subscribe
- Mute
- Subscribe to RSS Feed
- Permalink
- Report Inappropriate Content
Without selection? Not sure I understand your requirement completely. Would you be able to elaborate? May be you are looking for Cycle Group???
- Mark as New
- Bookmark
- Subscribe
- Mute
- Subscribe to RSS Feed
- Permalink
- Report Inappropriate Content
If you are looking for some kind of slide show, time triggered change of the charts shown, have a look at my answer here:
- Mark as New
- Bookmark
- Subscribe
- Mute
- Subscribe to RSS Feed
- Permalink
- Report Inappropriate Content
Hi,
one solution might be:
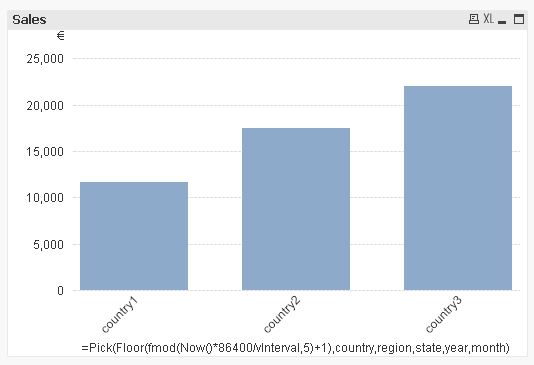
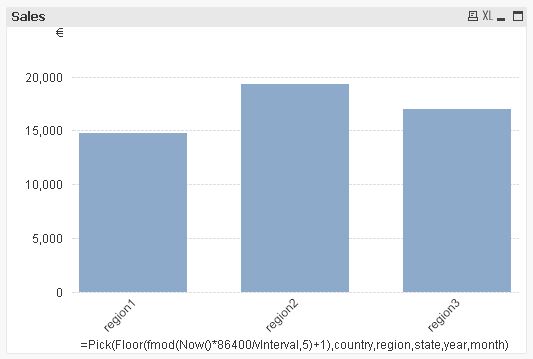
Dimension:
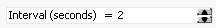
=Pick(Floor(fmod(Now()*86400/vInterval,5)+1),country,region,state,year,month)
Expression:
=Sum(sales)+0*Now()
hope this helps
regards
Marco