Unlock a world of possibilities! Login now and discover the exclusive benefits awaiting you.
- Qlik Community
- :
- All Forums
- :
- QlikView App Dev
- :
- Re: how to get an expression to work for a pivot t...
- Subscribe to RSS Feed
- Mark Topic as New
- Mark Topic as Read
- Float this Topic for Current User
- Bookmark
- Subscribe
- Mute
- Printer Friendly Page
- Mark as New
- Bookmark
- Subscribe
- Mute
- Subscribe to RSS Feed
- Permalink
- Report Inappropriate Content
how to get an expression to work for a pivot table where it is working for an individual period
Hi,
How do I get either of the following expression to work in a pivot table where I'm trying to show individual values for 12 Months (Fiscal Year Beginning on Jul until Jun)
In following formula I've to select a month and a year for it to give calculated value for a particular month. It is working as I need for individual month that is being selected but I want it to work for a pivot table with 12 Month
=Num(
avg(
aggr(
avg( {< [Discharge Month],[Numeric Discharge Month]={$(=Max({< [Discharge Month]={"$(vMonthYearString)"} >} [Numeric Discharge Month]))} >}
Aggr(count({< [CAHPS Count Flag]={1}, [CAHPS Questions Flag]={1}, [Top Box Flag]={1}, [Discharge Month], [CAHPS Dash Domain]={"*"},[Numeric Discharge Month]={$(=Max({< [Discharge Month]={"$(vMonthYearString)"} >} [Numeric Discharge Month]))} >} DISTINCT [Survey ID])
/
count( {< [CAHPS Count Flag]={1}, [CAHPS Questions Flag]={1}, [Discharge Month], [CAHPS Dash Domain]={"*"},[Numeric Discharge Month]={$(=Max({< [Discharge Month]={"$(vMonthYearString)"} >} [Numeric Discharge Month]))} >} DISTINCT [Survey ID])
, [CAHPS Question], [CAHPS Dash Domain]
)
)
,[CAHPS Dash Domain])
)
, '##.0%')
Following images shows individually calculated value for each month
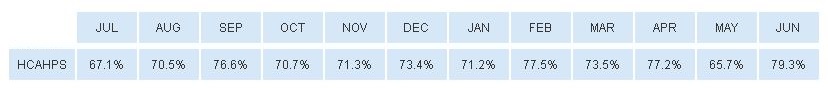


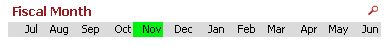
Pivot table shows values for selected month where I want it to display all 12 month without the requirement of selecting month.
Thanks,
Vijay
- Mark as New
- Bookmark
- Subscribe
- Mute
- Subscribe to RSS Feed
- Permalink
- Report Inappropriate Content
Would you be able to share a sample to take a closer look at the expression to propose something?
- Mark as New
- Bookmark
- Subscribe
- Mute
- Subscribe to RSS Feed
- Permalink
- Report Inappropriate Content
Hi Sunny,
I'm thankful for your response.
I'm trying to figure out how I can provide information that will be generic but still as per my data set to give accurate scenario. It is taking longer than I can imagine. I'll post once I'm ready with it.
Regards,
Vijay
- Mark as New
- Bookmark
- Subscribe
- Mute
- Subscribe to RSS Feed
- Permalink
- Report Inappropriate Content
I was able to get it working. There were two issues. I had to change data model for my data and second I was missing a grouping dimension (Month) in AGGR function and had to remove month evaluation from set expression.
=Num(
avg(
aggr(
avg(
Aggr(count( {< [CAHPS Count Flag]={1}, [CAHPS Questions Flag]={1}, [Top Box Flag]={1}, [CAHPS Dash Domain]={"*"} >} DISTINCT [Survey ID])
/
count( {< [CAHPS Count Flag]={1}, [CAHPS Questions Flag]={1}, [CAHPS Dash Domain]={"*"} >} DISTINCT [Survey ID])
, [CAHPS Question], [CAHPS Dash Domain], [Discharge Month]
)
)
,[CAHPS Dash Domain], [Discharge Month])
)
, '##.0%') 