Unlock a world of possibilities! Login now and discover the exclusive benefits awaiting you.
- Qlik Community
- :
- All Forums
- :
- QlikView App Dev
- :
- Re: how to get chart from pivot table
- Subscribe to RSS Feed
- Mark Topic as New
- Mark Topic as Read
- Float this Topic for Current User
- Bookmark
- Subscribe
- Mute
- Printer Friendly Page
- Mark as New
- Bookmark
- Subscribe
- Mute
- Subscribe to RSS Feed
- Permalink
- Report Inappropriate Content
how to get chart from pivot table
| Serial_NO | Model | |
| 1 | A | |
| 2 | B | |
| 3 | C | |
| 4 | D | |
| 5 | A | |
| 6 | FA | |
| 7 | G | |
| 8 | A | |
| 1 | A | |
| 1 | A | |
| 2 | B | |
| 4 | D | |
| 5 | A | |
| Pivot table | ||
| Serial_NO | COUNT SERIAL | MODEL |
| 1 | 2 | A |
| 2 | 1 | B |
| 4 | 2 | D |
| 5 | 2 | A |
Is it possible to get this pivot chart in to a chart(in the pivot table not all serial numbers and models are taken due to a script but this is not necessary), because if i now make the chart i will get all the data from the complete table and this i dont want :
- Tags:
- qlikview_scripting
- Mark as New
- Bookmark
- Subscribe
- Mute
- Subscribe to RSS Feed
- Permalink
- Report Inappropriate Content
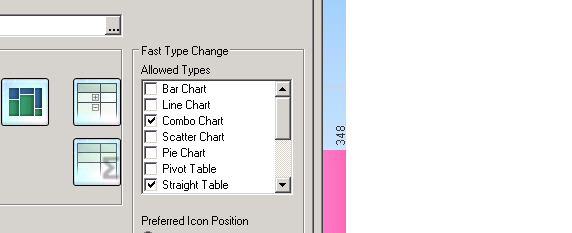
In Chart you can select tick from General Tab - > Fast Change option can be convert pivot into chart
please refer pic for setting.
Hope this helps you
Vikas
If the issue is solved please mark the answer with Accept as Solution & like it.
If you want to go quickly, go alone. If you want to go far, go together.
- Mark as New
- Bookmark
- Subscribe
- Mute
- Subscribe to RSS Feed
- Permalink
- Report Inappropriate Content
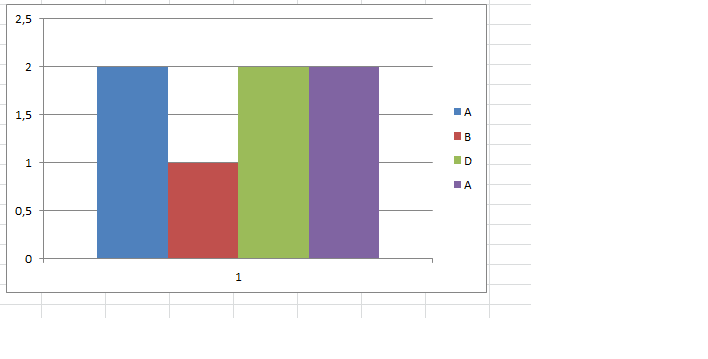
Unfortunately it doesn't show the good values.
first i need to count all the same models which are in the pivot table and then plot that...
now i get this:

as you can see in the last listbox i get 191 but i want only the sum of the selected models in the pivot table(now you see only one model) but if i have more models i want to sum/count all the same models and plot this in to a chart..
- Mark as New
- Bookmark
- Subscribe
- Mute
- Subscribe to RSS Feed
- Permalink
- Report Inappropriate Content
Hi,
Can you post your sample APP.
Regards
ASHFAQ