Unlock a world of possibilities! Login now and discover the exclusive benefits awaiting you.
- Qlik Community
- :
- All Forums
- :
- QlikView App Dev
- :
- Re: how to make pie chart show proportion of selec...
- Subscribe to RSS Feed
- Mark Topic as New
- Mark Topic as Read
- Float this Topic for Current User
- Bookmark
- Subscribe
- Mute
- Printer Friendly Page
- Mark as New
- Bookmark
- Subscribe
- Mute
- Subscribe to RSS Feed
- Permalink
- Report Inappropriate Content
how to make pie chart show proportion of selected values in total including unselected
Hi.
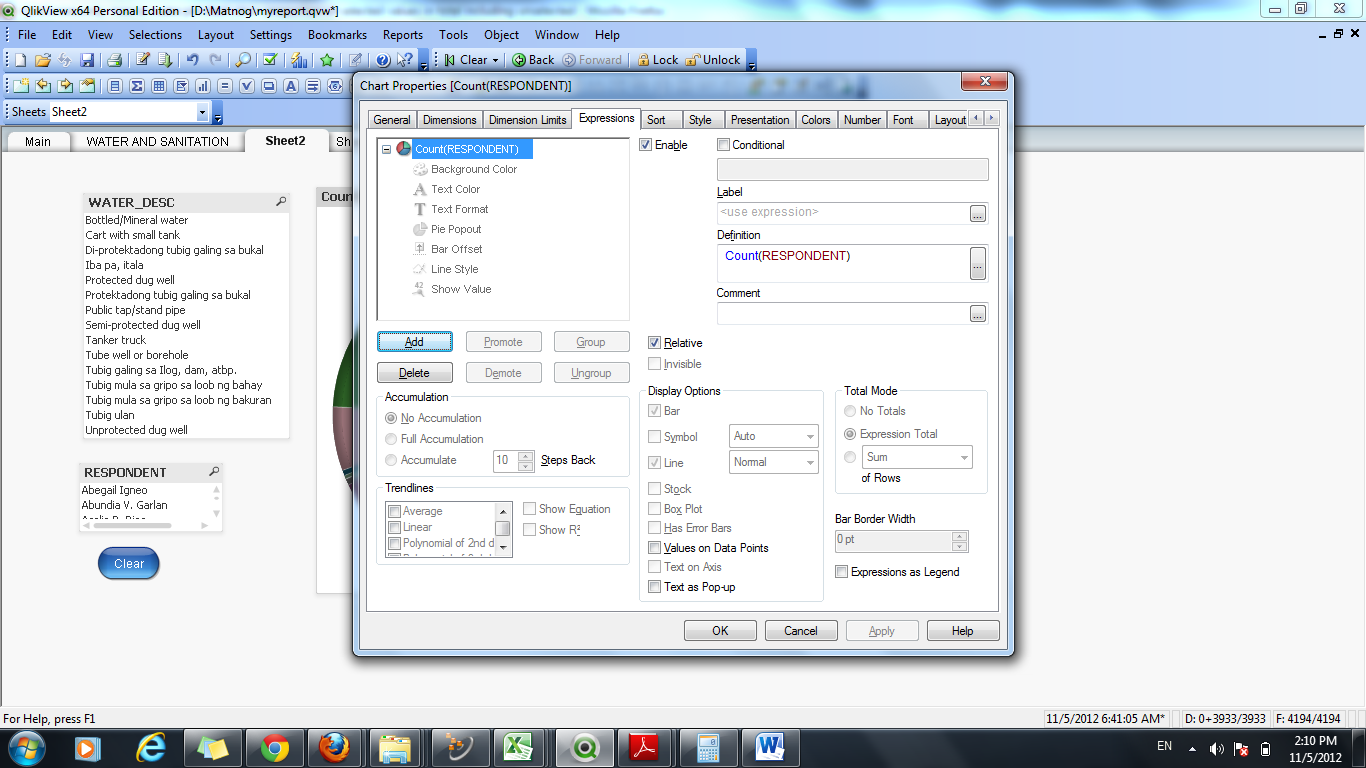
Sorry for the lengthy subject (which may sound stupid to many). A newbie here and I think I am doing something wrong. My problem is that I couldn't make the pie chart show the correct proportion of the selected values in the total. I am attaching screenshots to better explain my problem. The first image which shows all the values is okay. However, if I select values from the 'WATER_DESC" field list, the pie chart shows total only of the selected values. What I want to achieve is to get the proportion of the selected values in the total number of respondents.
Thanks and cheers.
- Tags:
- new_to_qlikview
- Mark as New
- Bookmark
- Subscribe
- Mute
- Subscribe to RSS Feed
- Permalink
- Report Inappropriate Content
Hi,
May I know your expression? How is it look like? Under expressions tab, did you check the relative box?
Regards,
Janzen
- Mark as New
- Bookmark
- Subscribe
- Mute
- Subscribe to RSS Feed
- Permalink
- Report Inappropriate Content
Hi, Janzen.
Thanks for responding. Yes, I checked the relative box. But it seems that it is only computing against the total number of respondents of the selected values not of the entire number of respondents...