Unlock a world of possibilities! Login now and discover the exclusive benefits awaiting you.
- Qlik Community
- :
- All Forums
- :
- QlikView App Dev
- :
- Re: how to make unique color
- Subscribe to RSS Feed
- Mark Topic as New
- Mark Topic as Read
- Float this Topic for Current User
- Bookmark
- Subscribe
- Mute
- Printer Friendly Page
- Mark as New
- Bookmark
- Subscribe
- Mute
- Subscribe to RSS Feed
- Permalink
- Report Inappropriate Content
how to make unique color
how to make unique color for the second column ?
- Tags:
- new_to_qlikview
Accepted Solutions
- Mark as New
- Bookmark
- Subscribe
- Mute
- Subscribe to RSS Feed
- Permalink
- Report Inappropriate Content
Hi,
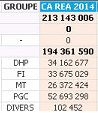
Firstly apply the scale,click on it as shown in figure 1,then right click on the chart for which you need to change the color, then click on custom format cell as shown in figure 2 , there you select the column and change the background color as shown in figure 3.
 figure 1
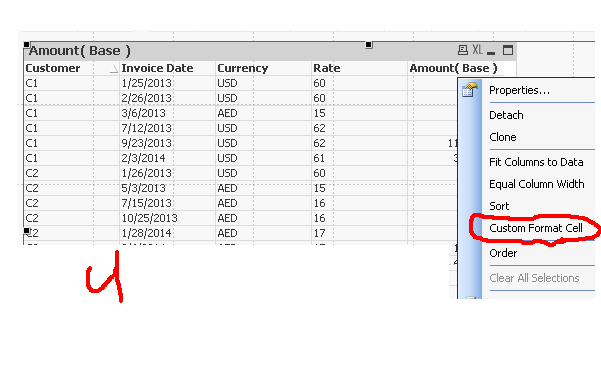 figure 2
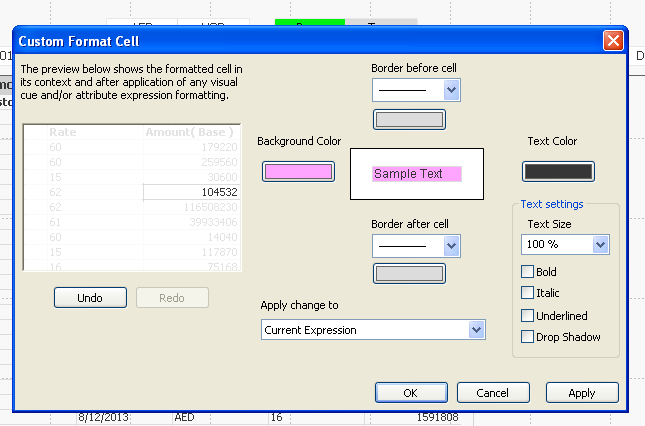 figure 3
- Mark as New
- Bookmark
- Subscribe
- Mute
- Subscribe to RSS Feed
- Permalink
- Report Inappropriate Content
Right click Chart > Chart Properties > Expressions >  on the 'second column' > Background color > Definition
Add: RGB (#,#,#)
- Mark as New
- Bookmark
- Subscribe
- Mute
- Subscribe to RSS Feed
- Permalink
- Report Inappropriate Content
Like Kim said
Right click Chart > Chart Properties > Expressions > on the 'second column' > Background color > RED()
- Mark as New
- Bookmark
- Subscribe
- Mute
- Subscribe to RSS Feed
- Permalink
- Report Inappropriate Content
What do you mean by unique color??
You can define ARGB color coding in background or you can use color mix wizard which will give unique color for every fulfilled condition defined in it
- Mark as New
- Bookmark
- Subscribe
- Mute
- Subscribe to RSS Feed
- Permalink
- Report Inappropriate Content
Hi,
Firstly apply the scale,click on it as shown in figure 1,then right click on the chart for which you need to change the color, then click on custom format cell as shown in figure 2 , there you select the column and change the background color as shown in figure 3.
figure 1figure 2figure 3