Unlock a world of possibilities! Login now and discover the exclusive benefits awaiting you.
- Qlik Community
- :
- All Forums
- :
- QlikView App Dev
- :
- Re: how to plot a bar chart by grouping the values...
Options
- Subscribe to RSS Feed
- Mark Topic as New
- Mark Topic as Read
- Float this Topic for Current User
- Bookmark
- Subscribe
- Mute
- Printer Friendly Page
Turn on suggestions
Auto-suggest helps you quickly narrow down your search results by suggesting possible matches as you type.
Showing results for
Not applicable
2016-10-10
09:10 AM
- Mark as New
- Bookmark
- Subscribe
- Mute
- Subscribe to RSS Feed
- Permalink
- Report Inappropriate Content
how to plot a bar chart by grouping the values on X-axis
Hi all
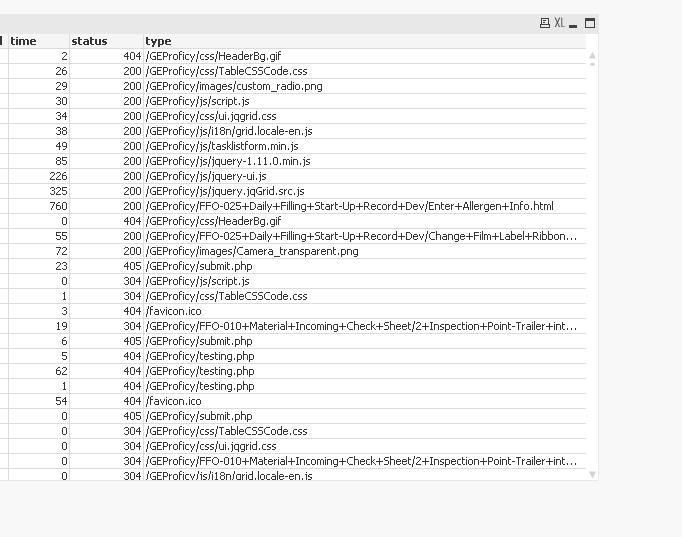
I want to plot a bar chart for the above table. I want the column "type" to be on the x-axis and the time on the y-axis.
But, i would like to group the rows which end with same name(like .php,.js,.css) in column "type".
please ask me , if I am not clear in my exlaination
Thanks
1,875 Views
- « Previous Replies
-
- 1
- 2
- Next Replies »
11 Replies
MVP
2016-10-12
11:38 AM
- Mark as New
- Bookmark
- Subscribe
- Mute
- Subscribe to RSS Feed
- Permalink
- Report Inappropriate Content
Ganesh -
Create a new field for file extension in the script like this to make your life easier
SubField([cs-uri-query], '.', -1) as File_Extension
Not applicable
2016-10-12
11:42 AM
Author
- Mark as New
- Bookmark
- Subscribe
- Mute
- Subscribe to RSS Feed
- Permalink
- Report Inappropriate Content
Thanks very much
- « Previous Replies
-
- 1
- 2
- Next Replies »