Unlock a world of possibilities! Login now and discover the exclusive benefits awaiting you.
- Qlik Community
- :
- All Forums
- :
- QlikView App Dev
- :
- Re: how to plot values inside segments in a pie ch...
- Subscribe to RSS Feed
- Mark Topic as New
- Mark Topic as Read
- Float this Topic for Current User
- Bookmark
- Subscribe
- Mute
- Printer Friendly Page
- Mark as New
- Bookmark
- Subscribe
- Mute
- Subscribe to RSS Feed
- Permalink
- Report Inappropriate Content
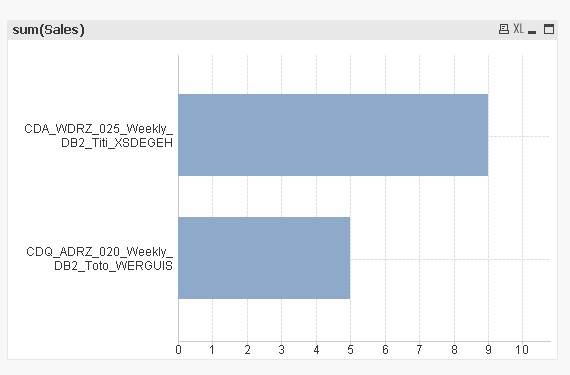
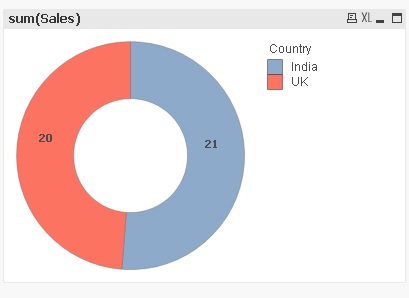
how to plot values inside segments in a pie chart. please see the image below for example

- Mark as New
- Bookmark
- Subscribe
- Mute
- Subscribe to RSS Feed
- Permalink
- Report Inappropriate Content
Hi,
For pie chart and donut "Value inside segement" option doesn't exists.
- Mark as New
- Bookmark
- Subscribe
- Mute
- Subscribe to RSS Feed
- Permalink
- Report Inappropriate Content
If does not exists, what is the solution you are suggesting because I need to do for a client?
- Mark as New
- Bookmark
- Subscribe
- Mute
- Subscribe to RSS Feed
- Permalink
- Report Inappropriate Content
There is surely a workaround. I'am looking for it.
- Mark as New
- Bookmark
- Subscribe
- Mute
- Subscribe to RSS Feed
- Permalink
- Report Inappropriate Content
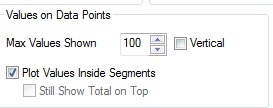
One solution is to overlap a second pie chart and display only value point for this.
- Mark as New
- Bookmark
- Subscribe
- Mute
- Subscribe to RSS Feed
- Permalink
- Report Inappropriate Content
Thanks a lot
- Mark as New
- Bookmark
- Subscribe
- Mute
- Subscribe to RSS Feed
- Permalink
- Report Inappropriate Content
Hi Jean, Thanks a lot, please also help below , How to show the full description name of my dimension.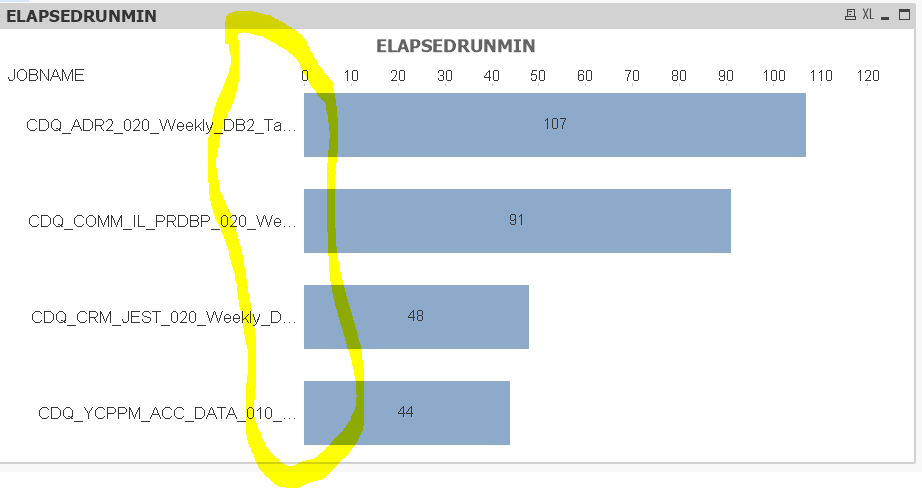
- Mark as New
- Bookmark
- Subscribe
- Mute
- Subscribe to RSS Feed
- Permalink
- Report Inappropriate Content
As dimension , try with :
mid(JOBNAME,1,FindOneOf(JOBNAME,'_',4))&chr(10)&mid(FindOneOf(JOBNAME,'_',4),len(JOBNAME))
- Mark as New
- Bookmark
- Subscribe
- Mute
- Subscribe to RSS Feed
- Permalink
- Report Inappropriate Content
Use instead :
mid(JOBCODE,1,FindOneOf(JOBCODE,'_',4))&chr(10)&mid(JOBCODE,FindOneOf(JOBCODE,'_',4)+1,len(JOBCODE))
It should works, it returns dimension label on 2 lines. Is it what you're trying to achieve?