Unlock a world of possibilities! Login now and discover the exclusive benefits awaiting you.
- Qlik Community
- :
- All Forums
- :
- QlikView App Dev
- :
- how to show marketshare in bar chart
- Subscribe to RSS Feed
- Mark Topic as New
- Mark Topic as Read
- Float this Topic for Current User
- Bookmark
- Subscribe
- Mute
- Printer Friendly Page
- Mark as New
- Bookmark
- Subscribe
- Mute
- Subscribe to RSS Feed
- Permalink
- Report Inappropriate Content
how to show marketshare in bar chart
Hi guys
complete newbie to QV
I have prepared what is in the image below.
I want to be able to calculate the market share of each Salesman ID and show it on the chart.
I think the ideal chart type for this is combo chart.
Any ideas how I do this please?
I specifically need the expression and need to be told where to put it.
cheerz guys
I have a 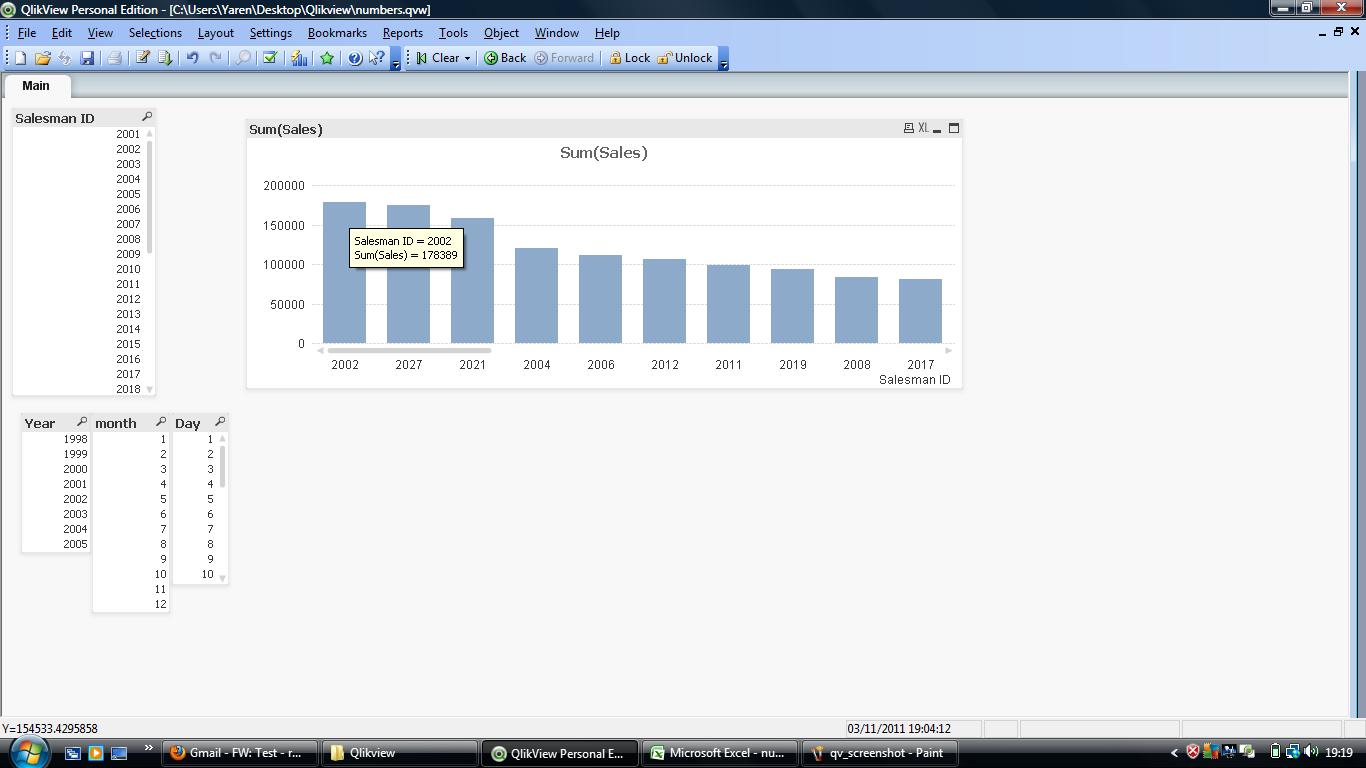
Accepted Solutions
- Mark as New
- Bookmark
- Subscribe
- Mute
- Subscribe to RSS Feed
- Permalink
- Report Inappropriate Content
you can add the expression:
aggr(sum(sales),salesmanID)/sum(sales)
hope this expression will work.
try it out.
- Mark as New
- Bookmark
- Subscribe
- Mute
- Subscribe to RSS Feed
- Permalink
- Report Inappropriate Content
you can take another expression of market share in this bar chart which shows market share of each salesman.
but if you want to show market share then this can better describe through pie chart.
but if you want to show in this graph only then simply add the expression for market share.
this expression you have to decide as i don't know your database.
- Mark as New
- Bookmark
- Subscribe
- Mute
- Subscribe to RSS Feed
- Permalink
- Report Inappropriate Content
thank for the reply.
I have learned how to do the marketshare in a pie chart.
All I want to do is simply devide the total of each individual by everyones total.
Where sum(sales) for salesman_ID 2002 is 178389 (as shown in image), and the whole sales total is 2317233
I want to do this =178389/2317233
and show it as percentage in the chart as a line graph.
hope I'm clear
- Mark as New
- Bookmark
- Subscribe
- Mute
- Subscribe to RSS Feed
- Permalink
- Report Inappropriate Content
Hi rizo,
You can add another expression in your combo chart:
sum(sales)/sum(TOTAL (sales)).
After that you can chose how you want to display the expression. Chose "Line" and if you want to see the Values chose "Values on Data Points". To see this Values as percentage, go to the Number tab and chose "Show in Percent".
Regards
David
- Mark as New
- Bookmark
- Subscribe
- Mute
- Subscribe to RSS Feed
- Permalink
- Report Inappropriate Content
I tried that except i didnt put TOTAL (sales) in brackets.
I will try this tonight and horefully it'll work.
thanks for the the help
- Mark as New
- Bookmark
- Subscribe
- Mute
- Subscribe to RSS Feed
- Permalink
- Report Inappropriate Content
you can add the expression:
aggr(sum(sales),salesmanID)/sum(sales)
hope this expression will work.
try it out.
- Mark as New
- Bookmark
- Subscribe
- Mute
- Subscribe to RSS Feed
- Permalink
- Report Inappropriate Content
will try em and ley you guys know
- Mark as New
- Bookmark
- Subscribe
- Mute
- Subscribe to RSS Feed
- Permalink
- Report Inappropriate Content
just some feedback guys.
they didnt work because i had 2 dimensions set.
but thet did work when i removed one.
so both expressions are correct.
thanks for the help guys
- Mark as New
- Bookmark
- Subscribe
- Mute
- Subscribe to RSS Feed
- Permalink
- Report Inappropriate Content
Rizo98
Make sure you have the Combo chart type selected and set one expression to be a bar and the other to be a line. When you then look at the AXIS tab you can set each dimension to have a seperate axis which should then allow you to have both expressions on the same chart
Ta
Lewis
- Mark as New
- Bookmark
- Subscribe
- Mute
- Subscribe to RSS Feed
- Permalink
- Report Inappropriate Content
i did just that.
thanks