Unlock a world of possibilities! Login now and discover the exclusive benefits awaiting you.
- Qlik Community
- :
- All Forums
- :
- QlikView App Dev
- :
- Re: how to show missing/zero values in charts
- Subscribe to RSS Feed
- Mark Topic as New
- Mark Topic as Read
- Float this Topic for Current User
- Bookmark
- Subscribe
- Mute
- Printer Friendly Page
- Mark as New
- Bookmark
- Subscribe
- Mute
- Subscribe to RSS Feed
- Permalink
- Report Inappropriate Content
how to show missing/zero values in charts
I have an interesting problem. I would like qlikview to show me all values in a chart even if the value is 0. I have charts that are used to compare different product types at my company. the issue is that when end-user selects a given product, qlikview re evaluates dataset and then returns where there are values. This can be confusing when One selection has 11 months of data and the other has 12. The charts are now "offset" and user has to understand that the relationship changed.
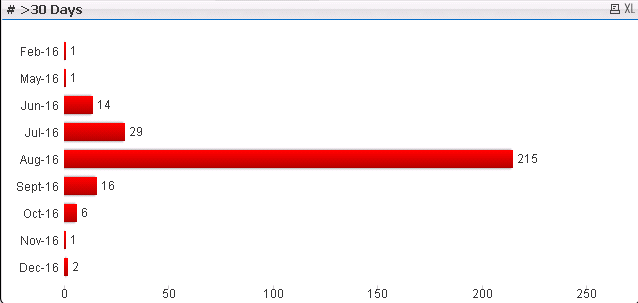
Here's a good example. When I make a selection, there is no data for March, April. In another subset there is data for March/April, so end-user gets confused when reading this. Is there a way to have qlikview include all my date values and just say '0' when there is no value? I tried "Show all values" box but this did not resolve the issue. Any help is appreciated.
Accepted Solutions
- Mark as New
- Bookmark
- Subscribe
- Mute
- Subscribe to RSS Feed
- Permalink
- Report Inappropriate Content
Did you try unchecking Supress Zero values in Presentation tab? Try checking Zero on Bars and see ?

- Mark as New
- Bookmark
- Subscribe
- Mute
- Subscribe to RSS Feed
- Permalink
- Report Inappropriate Content
Hi,
You have to use OUTER JOIN in your script. See my attached .qvw, i think it's what you're trying to achieve.
regards
- Mark as New
- Bookmark
- Subscribe
- Mute
- Subscribe to RSS Feed
- Permalink
- Report Inappropriate Content
Hi Jean - thanks for your reply, however I don't think this is the solution I'm looking for. I shouldn't have to do any scripting to accomplish this as I'm not using more dataset. This is one dataset with different filters applied.
- Mark as New
- Bookmark
- Subscribe
- Mute
- Subscribe to RSS Feed
- Permalink
- Report Inappropriate Content
Did you try unchecking Supress Zero values in Presentation tab? Try checking Zero on Bars and see ?
- Mark as New
- Bookmark
- Subscribe
- Mute
- Subscribe to RSS Feed
- Permalink
- Report Inappropriate Content
HI Duke Luke,
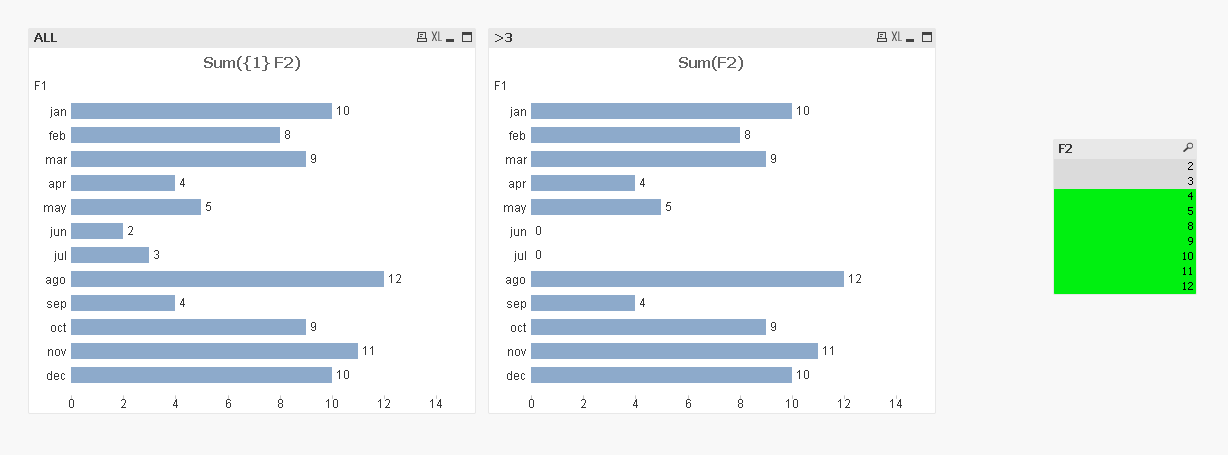
If I have understood well, a possible solution would be a combination of:
- Dimensions > Check "Show All Values" +
- Dimensions > Check "Supress When Value is Null" +
- Presentation > Unchek "Supress Zero-Values" +
- Presentation > Chek "Zero on Bars"
I attach you the QV file of this sample:
Regards,
Héctor
- Mark as New
- Bookmark
- Subscribe
- Mute
- Subscribe to RSS Feed
- Permalink
- Report Inappropriate Content
How can I do this in Qlik Sense? I am also using Vislib...