Unlock a world of possibilities! Login now and discover the exclusive benefits awaiting you.
- Qlik Community
- :
- All Forums
- :
- QlikView App Dev
- :
- how to show the chart expression dynamically?
- Subscribe to RSS Feed
- Mark Topic as New
- Mark Topic as Read
- Float this Topic for Current User
- Bookmark
- Subscribe
- Mute
- Printer Friendly Page
- Mark as New
- Bookmark
- Subscribe
- Mute
- Subscribe to RSS Feed
- Permalink
- Report Inappropriate Content
how to show the chart expression dynamically?
Hi,
I have 5 metrics(example(GWP,GEP,GEC,CO,GCD),I need to create list drop down for those.
I need to create a chart based on metrics.
whenever user selects one metrics from list box then related metrics should populate in expression.
How can i make list box and based on that how can i show chart?
Thanks,
Raj
- Tags:
- new_to_qlikview
- Mark as New
- Bookmark
- Subscribe
- Mute
- Subscribe to RSS Feed
- Permalink
- Report Inappropriate Content
Create a Inline at backend/script like:
Test:
Load * inline
[MetricsName, MetricNo
GWP, 1
GEP, 2
GEC,3
CO, 4
GCD,5
];
Now take, MetricsNAme in Listbox, prepare a chart write down their relevant expression,
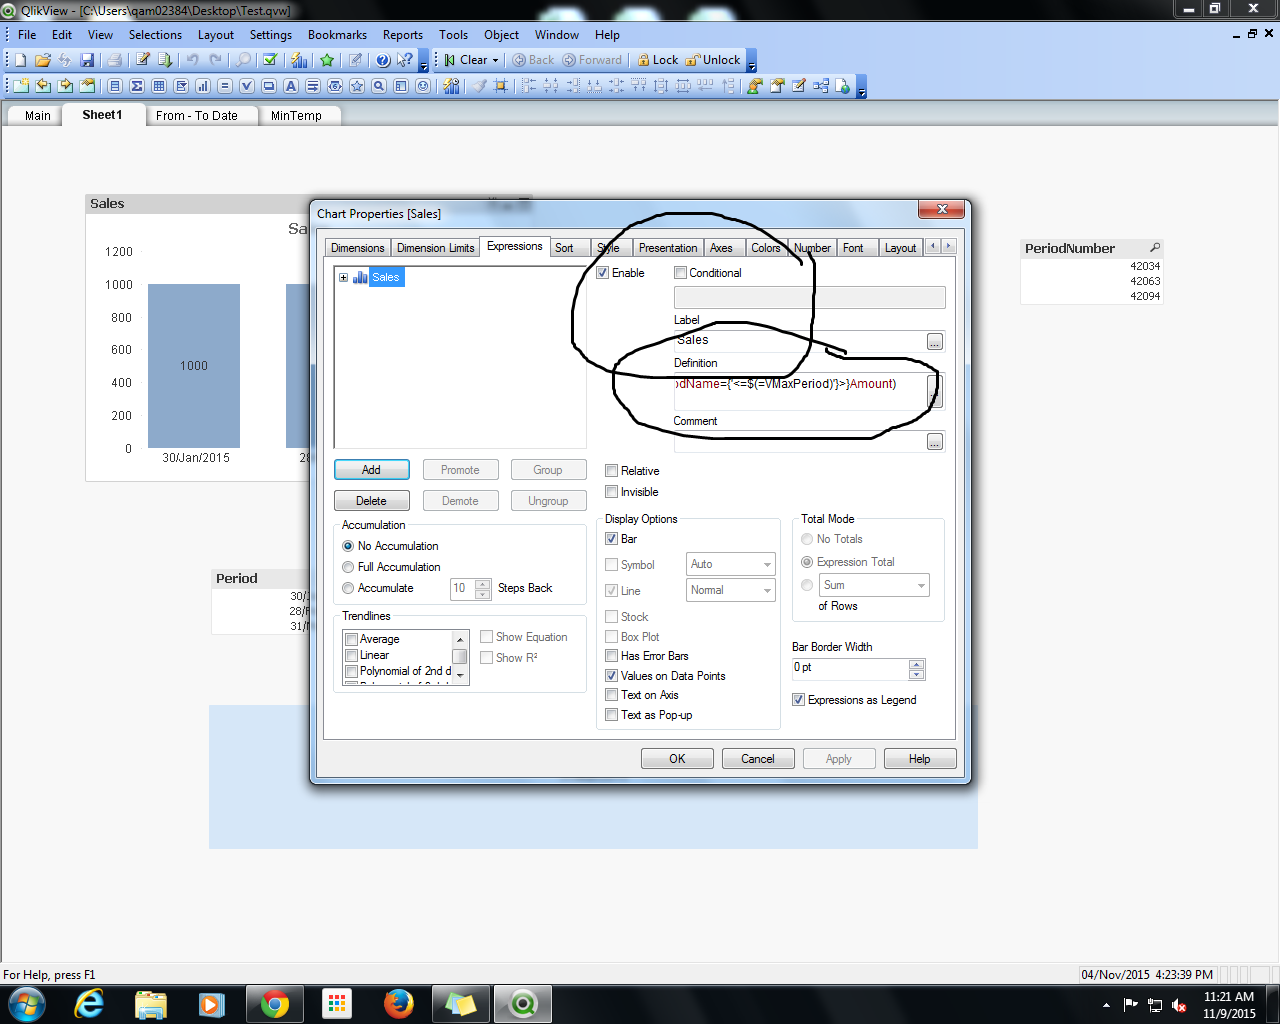
Now say , you have created expression in Chart Object properties under Expression tab:
Then make it Conditional Enable and write down one condition like:
=MetricNo=1 for GWP //Similarly for Others, Use metric no for others as well..
Hope this will help!!!
- Mark as New
- Bookmark
- Subscribe
- Mute
- Subscribe to RSS Feed
- Permalink
- Report Inappropriate Content
Hope it will help you!!
PFA..
- Mark as New
- Bookmark
- Subscribe
- Mute
- Subscribe to RSS Feed
- Permalink
- Report Inappropriate Content
HI ,
Try some thing like,
Load * inline
[
Metric
GWP
GEP
GEC
CO
GCD
];
Create a variable and assign Metric Field to the variable and then use the variable in the expression like,
In variable Overview add a variable vMetric
vMetric=Metric
=sum({<Metric={'(=$(vMetric))'}>}sales)
- Mark as New
- Bookmark
- Subscribe
- Mute
- Subscribe to RSS Feed
- Permalink
- Report Inappropriate Content
create an inline table for all your metric and then in the expression you have the option of conditional enable for the expression . Based in the user selection i.e. metric you can enable the related metric in the expression .