Unlock a world of possibilities! Login now and discover the exclusive benefits awaiting you.
- Qlik Community
- :
- All Forums
- :
- QlikView App Dev
- :
- Re: if else.. issue
- Subscribe to RSS Feed
- Mark Topic as New
- Mark Topic as Read
- Float this Topic for Current User
- Bookmark
- Subscribe
- Mute
- Printer Friendly Page
- Mark as New
- Bookmark
- Subscribe
- Mute
- Subscribe to RSS Feed
- Permalink
- Report Inappropriate Content
if else.. issue
Hi,
I have a requirement as briefed below,
Please refer the table below,
account id, description, amount
1, Salary, 100
2, Bonus, 20
from above table I need to build a chart to show the salary & Salary + Bonus trendline. If condition doesn't helps..
Salary = 100
Salary+Bonus = 100 + 20 = 120
Could anyone please help me on this?
Thanks & Regards,
Karthikeyan.
- « Previous Replies
-
- 1
- 2
- Next Replies »
- Mark as New
- Bookmark
- Subscribe
- Mute
- Subscribe to RSS Feed
- Permalink
- Report Inappropriate Content
I guess you want something like:
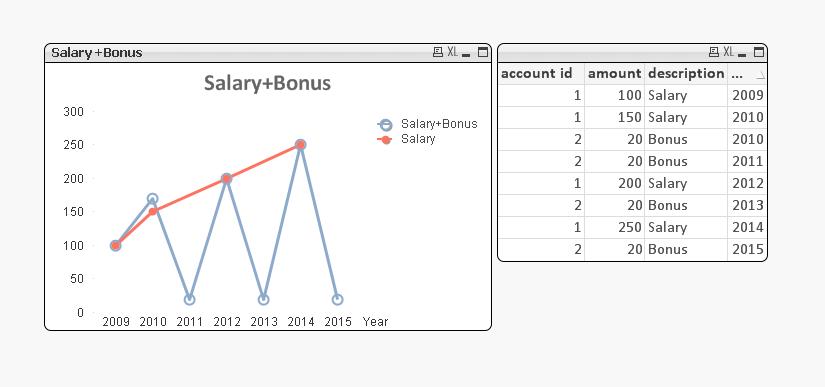
Some set analysis is helpful. However, it should work with an IF() as well. Set Analysis performs better
Peter
- Mark as New
- Bookmark
- Subscribe
- Mute
- Subscribe to RSS Feed
- Permalink
- Report Inappropriate Content
BTW I was assuming that a real trend line could easily jump over missing data points. For example, 2011 has no salary data but the Trend line will interpolate between 2010 and 2012.
- Mark as New
- Bookmark
- Subscribe
- Mute
- Subscribe to RSS Feed
- Permalink
- Report Inappropriate Content
Hi,
Try like this
Dimesion: account id
Salary Expression: Sum({<description={'Salary'}>} amount)
Salary + Bonue Expression: Salary Expression: Sum({<description={'Salary', 'Bonus'}>} amount)
- « Previous Replies
-
- 1
- 2
- Next Replies »