Unlock a world of possibilities! Login now and discover the exclusive benefits awaiting you.
- Qlik Community
- :
- All Forums
- :
- QlikView App Dev
- :
- is it possible to show 3 separate bars for one mon...
- Subscribe to RSS Feed
- Mark Topic as New
- Mark Topic as Read
- Float this Topic for Current User
- Bookmark
- Subscribe
- Mute
- Printer Friendly Page
- Mark as New
- Bookmark
- Subscribe
- Mute
- Subscribe to RSS Feed
- Permalink
- Report Inappropriate Content
is it possible to show 3 separate bars for one month & 3 different Year..??
Hi Folks ,
this is a kind of special requirement for me ,
1.we have 3 main categories of data each category(A,B,C) is having 3 (2013,2014,2015)years of data.
so my user wants to compare the his data based on different years , different Categories .
we are providing 3 slots for seelction of filters category , year and month.so we get around 9 combinations (Please use permutations and cominations  ).
).
in each slot he will select any one value from the each of the filters , it may be repeated values like same Category
ex: A,2013,Jul - slot1
A,2014,Jul - slot2
A,2015,Jul - slot3
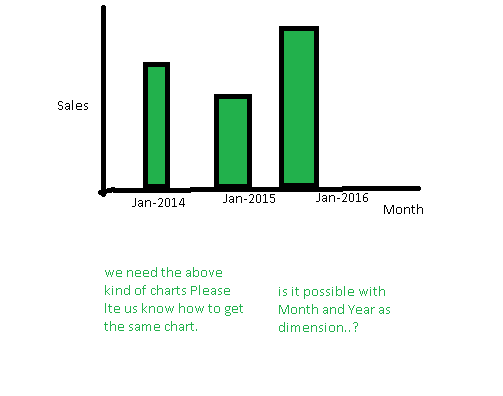
I want to show this kind of data in the Bar chart. and I want 3 separate bars for each Slot...Is it Possible ???
If possible Please respond with work around...
2. in my data I don't have data for B,2013,Aug selection , and in the second slot am selecting B,2014,Aug which is having value, and this second selection is over riding with the first section i.e it is showing B,2014,Aug selection data in B,2013,Aug.
Any way to avoid this...?, i want to show a empty bar or null value if no data available.
3. and am using Month as dimension and the legend is Jan , Feb,Mar,.....etc
I want to show this by concatenating with the respective year i.e if i select Aug , 2014 in the first slot i want to show Aug-2014 below of that particular bar...and if i select Nov,2015 then I have to show Nov-2015...Etc
Please respond with your possible suggestions...
Thanks in advance...please don't hesitate to ask me if you need any more information..
Regards,
Sra1.
- Mark as New
- Bookmark
- Subscribe
- Mute
- Subscribe to RSS Feed
- Permalink
- Report Inappropriate Content
yes you need to add 3 expressions and put in the where condition of the set analysis of each expression {<Slot={'Slotx'}>} and your dimension will be the month-year
- Mark as New
- Bookmark
- Subscribe
- Mute
- Subscribe to RSS Feed
- Permalink
- Report Inappropriate Content
Please is this answer your query,
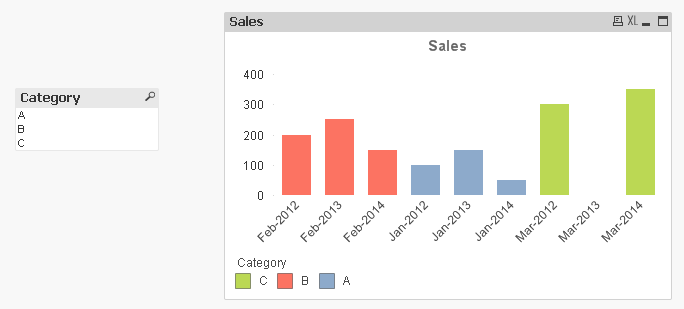
My Data is
t:
LOAD * INLINE [
Month, Year, Amount, Category
Jan, 2012, 100, A
Jan, 2013, 150, A
Jan, 2014, 50, A
Feb, 2012, 200, B
Feb, 2013, 250, B
Feb, 2014, 150, B
Mar, 2012, 300, C
Mar, 2013, 0, C
Mar, 2014, 350, C
];
t1:
Load
Month, Year, Amount, Category, Month&'-'&Year as MonthYear
Resident t;
drop Table t;
Used Bar chart with
Dimension: MonthYear, Category
Expression: sum(Amount)
Set Properties as
Style Tab: Subtype = Stacked
Presentation: Suppress Zero-Values = UnChecked
Output,