Unlock a world of possibilities! Login now and discover the exclusive benefits awaiting you.
- Qlik Community
- :
- All Forums
- :
- QlikView App Dev
- :
- legend colour change and graph content
- Subscribe to RSS Feed
- Mark Topic as New
- Mark Topic as Read
- Float this Topic for Current User
- Bookmark
- Subscribe
- Mute
- Printer Friendly Page
- Mark as New
- Bookmark
- Subscribe
- Mute
- Subscribe to RSS Feed
- Permalink
- Report Inappropriate Content
legend colour change and graph content
Hi all,
When I refresh my dashboard the colours on the graph change with it. So every day I get a different colour representing different points in my legend.
I have set the colours to persistent and my sort is by Y-value.
Is it possible to stop this daily change?
- Mark as New
- Bookmark
- Subscribe
- Mute
- Subscribe to RSS Feed
- Permalink
- Report Inappropriate Content
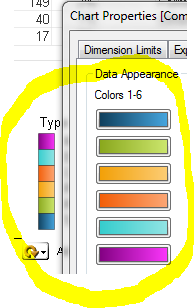
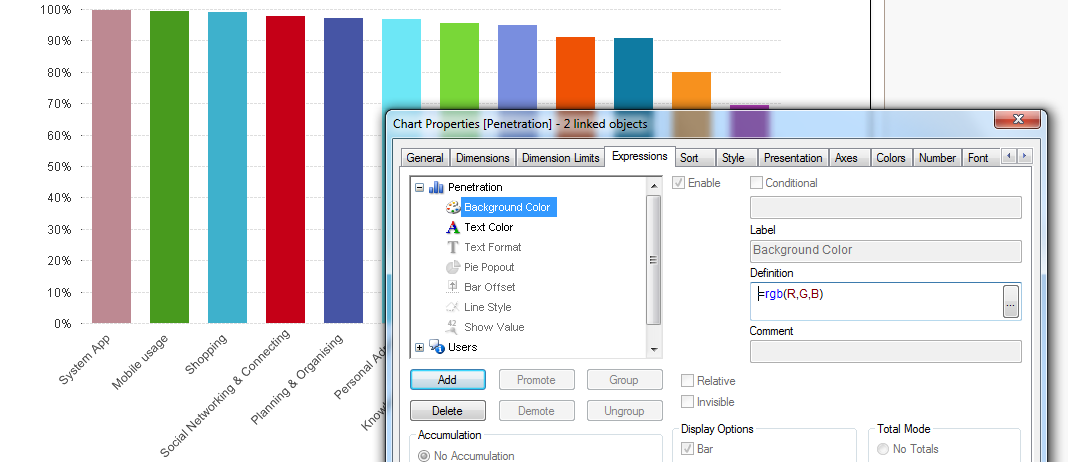
With a reload the order of the Y-value will probably change hence the color change. Instead of using these colors by index, you can use the background color of the expression (click on the plus sign in front of the expression to expand the options) and use an expression to define the color for each dimension value. Or alternatively load a color in the load script for each dimension value and use that in the background color expression.
- Mark as New
- Bookmark
- Subscribe
- Mute
- Subscribe to RSS Feed
- Permalink
- Report Inappropriate Content
Hi,
Ideally this should not happen. This might be a bug.
What version you are using?
Regards,
Kaushik Solanki
- Mark as New
- Bookmark
- Subscribe
- Mute
- Subscribe to RSS Feed
- Permalink
- Report Inappropriate Content
Hi Piet,
I really like this idea and never thought to use it this way. I will certainly give it go, thanks for that.
- Mark as New
- Bookmark
- Subscribe
- Mute
- Subscribe to RSS Feed
- Permalink
- Report Inappropriate Content
Hi Kaushik,
I am using QV 11.