Unlock a world of possibilities! Login now and discover the exclusive benefits awaiting you.
- Qlik Community
- :
- All Forums
- :
- QlikView App Dev
- :
- Re: legend filter
- Subscribe to RSS Feed
- Mark Topic as New
- Mark Topic as Read
- Float this Topic for Current User
- Bookmark
- Subscribe
- Mute
- Printer Friendly Page
- Mark as New
- Bookmark
- Subscribe
- Mute
- Subscribe to RSS Feed
- Permalink
- Report Inappropriate Content
legend filter
Hi
I have a requirement where user want to filter the values on a legend ( or it could be a list box which I might move and make it look like legend in the chart)
I have 2 columns group and function , each group have multiple functions , I have group as a filter and function and date as a dimensions in the chart with 2 expressions sum of sales and sum of products .
Can some one please suggest a better way to represent this , so basically user filter the data by group and I should provide the associated functions values to the selected group as a legend in the chart , and user will only select 1 function value for a group.
I was thinking of hierarchy, list box option with only one selected any other better ways ?
Thanks!
- Mark as New
- Bookmark
- Subscribe
- Mute
- Subscribe to RSS Feed
- Permalink
- Report Inappropriate Content
How about a Drill Down group for the Dimension ?
- Mark as New
- Bookmark
- Subscribe
- Mute
- Subscribe to RSS Feed
- Permalink
- Report Inappropriate Content
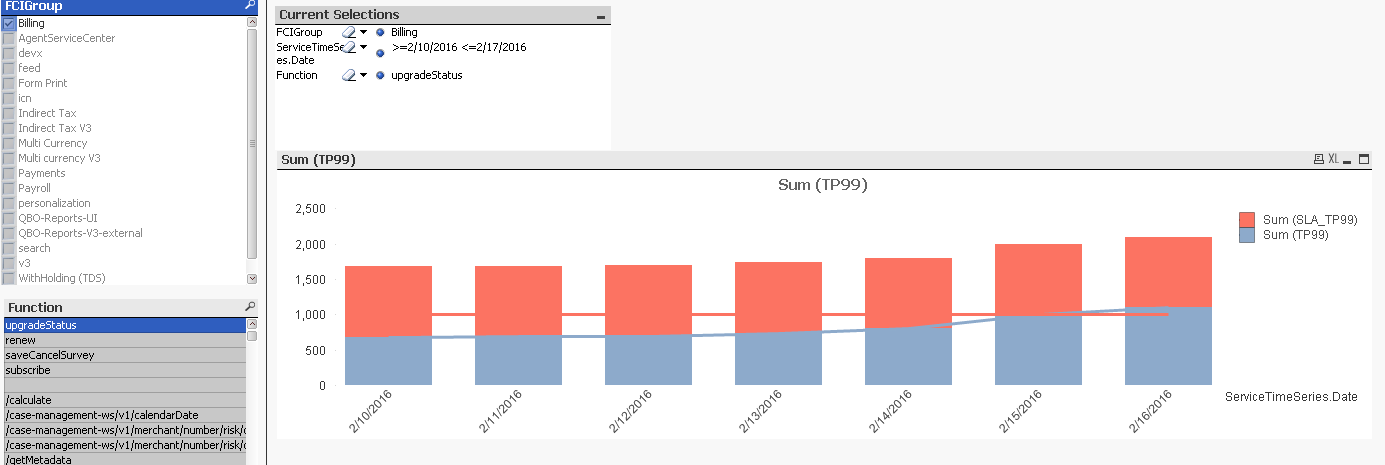
example please ... this is how it looks at present , the function filter should be as a legend in the chart so that user can pick 1 value out of multiple values associated with group selection , it would be even better if users knows what are the associated functions values for the selected group.And also y I am not able to see grouped bars ... ? instead of stacked one ? I am unable to changes this ..is it because I have 2 dimensions and 2 expressions?
- Mark as New
- Bookmark
- Subscribe
- Mute
- Subscribe to RSS Feed
- Permalink
- Report Inappropriate Content
Would you be able to share a sample qvw showing your scenario ?